Technical Analysis of FBND 2024-05-10
Overview:
In analyzing the technical indicators for FBND over the last 5 days, we will delve into the trend, momentum, volatility, and volume indicators to provide a comprehensive outlook on the possible stock price movement. By examining these key aspects, we aim to offer valuable insights and predictions for the upcoming days.
Trend Analysis:
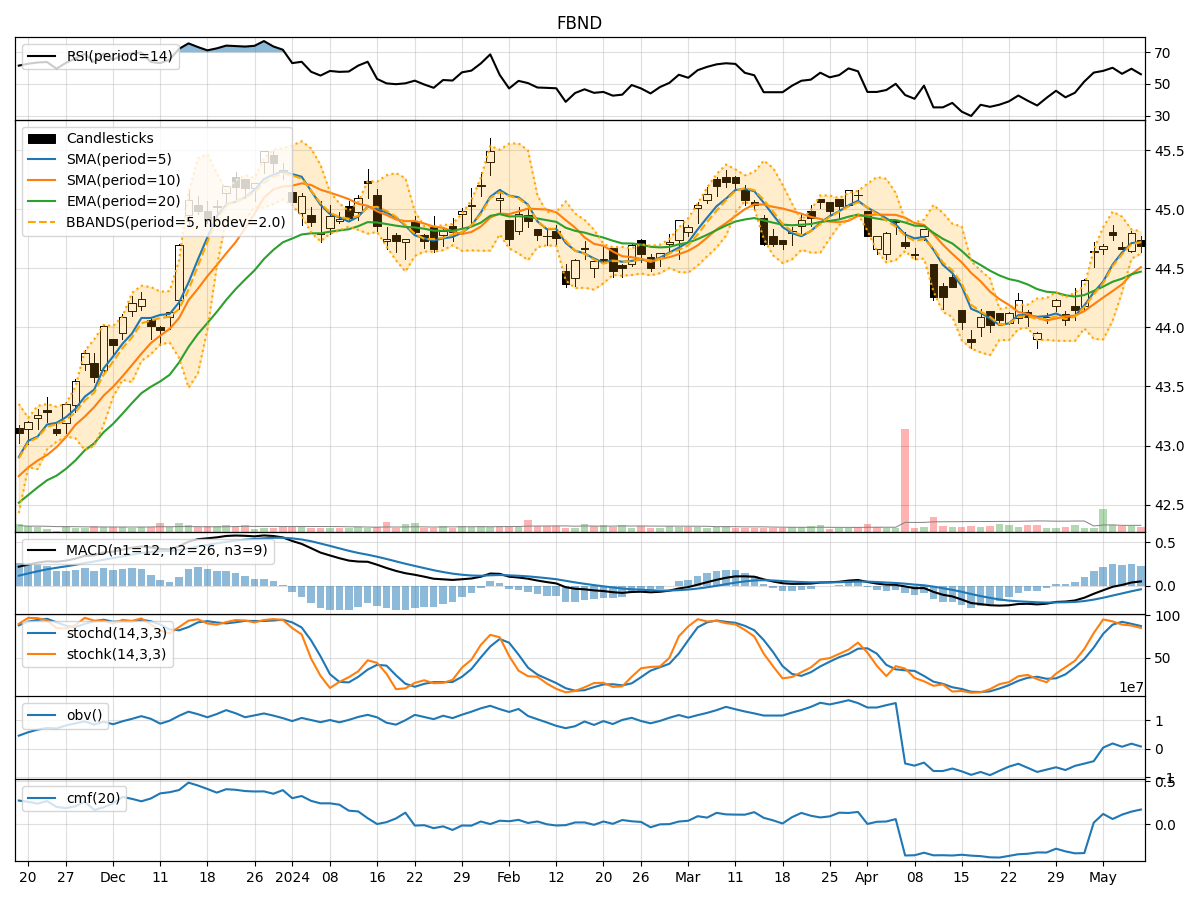
- Moving Averages (MA): The 5-day Moving Average (MA) has been consistently above the Simple Moving Average (SMA) and Exponential Moving Average (EMA), indicating a short-term bullish trend.
- MACD: The MACD line has been consistently above the signal line, with both lines showing an upward trend, suggesting bullish momentum.
- MACD Histogram: The MACD Histogram has been increasing over the past 5 days, indicating strengthening bullish momentum.
Momentum Analysis:
- RSI: The Relative Strength Index (RSI) has been fluctuating around the 50 level, indicating a neutral momentum.
- Stochastic Oscillator: Both %K and %D lines of the Stochastic Oscillator have been decreasing, suggesting a potential reversal in momentum.
- Williams %R: The Williams %R indicator has been in the oversold territory, indicating a possible bullish reversal.
Volatility Analysis:
- Bollinger Bands: The stock price has been trading within the Bollinger Bands, with the bands narrowing, suggesting a period of consolidation.
- Bollinger %B: The %B indicator has been hovering around the middle range, indicating a neutral volatility outlook.
Volume Analysis:
- On-Balance Volume (OBV): The OBV has been fluctuating, indicating indecision among investors regarding the stock.
- Chaikin Money Flow (CMF): The CMF has been positive, suggesting buying pressure in the stock.
Key Observations:
- The trend indicators point towards a bullish sentiment in the short term.
- Momentum indicators show a mixed signal, with potential for a bullish reversal.
- Volatility indicators suggest a period of consolidation.
- Volume indicators reflect indecision among investors.
Conclusion:
Based on the analysis of the technical indicators, the next few days for FBND could see upward movement in the stock price. The bullish trend indicated by moving averages and MACD, coupled with the potential bullish reversal suggested by momentum indicators, may lead to a positive price trajectory. However, the period of consolidation indicated by volatility indicators and the indecision among investors reflected in volume indicators should be monitored closely. Overall, the outlook for FBND appears bullish in the short term.