Technical Analysis of FBL 2024-05-10
Overview:
In analyzing the technical indicators for FBL stock over the last 5 days, we will delve into the trend, momentum, volatility, and volume indicators to provide a comprehensive outlook on the possible future stock price movement. By examining these key indicators, we aim to offer valuable insights and predictions for the upcoming trading days.
Trend Analysis:
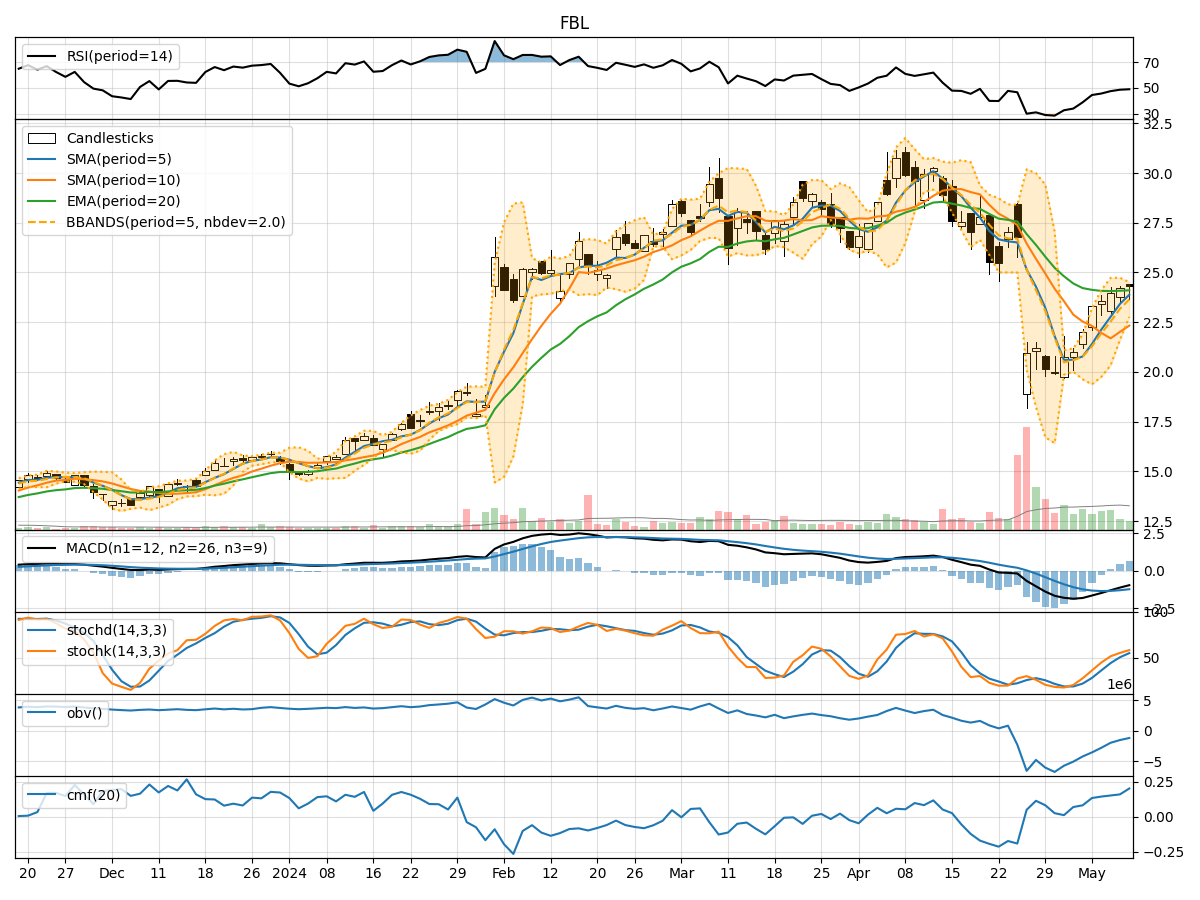
- Moving Averages (MA): The 5-day Moving Average (MA) has been consistently rising, indicating a bullish trend in the short term.
- MACD: The Moving Average Convergence Divergence (MACD) has been negative but showing signs of convergence towards the signal line, suggesting a potential trend reversal.
- RSI: The Relative Strength Index (RSI) has been gradually increasing, reflecting strengthening bullish momentum.
Momentum Analysis:
- Stochastic Oscillator: Both %K and %D of the Stochastic Oscillator have been rising, indicating increasing buying pressure and potential upward momentum.
- Williams %R: The Williams %R is in the oversold territory but has been improving, signaling a possible reversal to the upside.
Volatility Analysis:
- Bollinger Bands (BB): The Bollinger Bands have been narrowing, suggesting decreasing volatility and a possible period of consolidation.
- Average True Range (ATR): ATR has been decreasing, indicating a decline in price volatility.
Volume Analysis:
- On-Balance Volume (OBV): The OBV has been showing a positive trend, indicating accumulation by investors.
- Chaikin Money Flow (CMF): The CMF has been steadily increasing, suggesting strong buying pressure and positive money flow.
Key Observations:
- The trend indicators point towards a bullish sentiment in the short term, supported by rising moving averages and improving momentum.
- Volatility is decreasing, indicating a potential period of consolidation or a calm before a possible price movement.
- Volume indicators show positive accumulation and strong buying pressure, supporting the bullish outlook.
Conclusion:
Based on the analysis of the technical indicators, the next few days for FBL stock are likely to see upward movement. The bullish trend supported by the moving averages, improving momentum, positive volume accumulation, and decreasing volatility suggests a favorable outlook for the stock price. Traders and investors may consider buying opportunities in anticipation of further price appreciation.