Technical Analysis of FBCG 2024-05-10
Overview:
In analyzing the technical indicators for FBCG over the last 5 days, we will delve into the trend, momentum, volatility, and volume indicators to provide a comprehensive outlook on the possible stock price movement. By examining these key aspects, we aim to offer valuable insights and predictions for the upcoming days.
Trend Analysis:
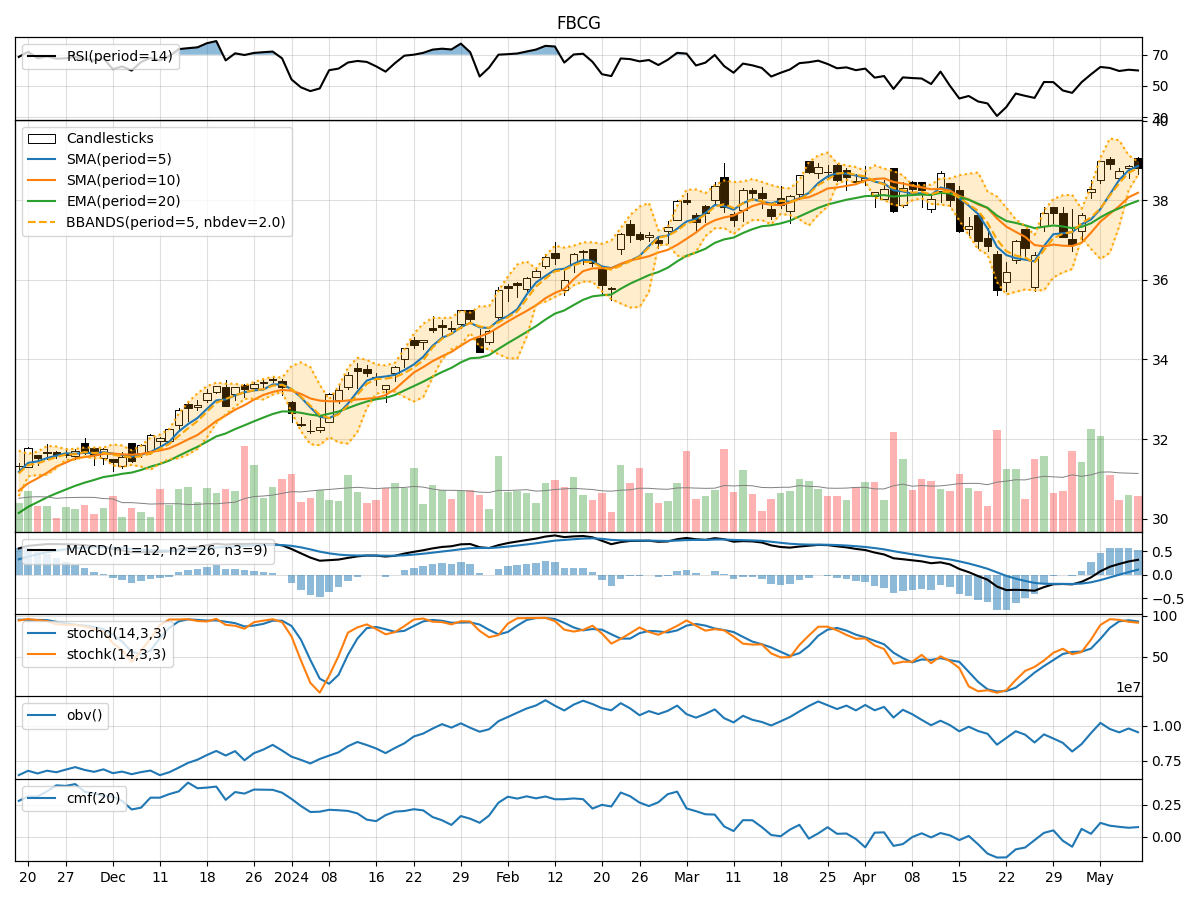
- Moving Averages (MA): The 5-day Moving Average (MA) has been consistently above the Simple Moving Average (SMA) and Exponential Moving Average (EMA), indicating a bullish trend.
- MACD: The MACD line has been above the signal line, with both showing an upward trend, suggesting positive momentum in the stock price.
- RSI: The Relative Strength Index (RSI) has been fluctuating around the 60-65 range, indicating a neutral stance in terms of overbought or oversold conditions.
Momentum Analysis:
- Stochastic Oscillator: The Stochastic Oscillator has been hovering in the overbought territory, suggesting a potential reversal or consolidation phase.
- Williams %R: The Williams %R indicator has been consistently in the oversold region, indicating a bearish sentiment in the short term.
Volatility Analysis:
- Bollinger Bands: The Bollinger Bands have been narrowing, indicating decreasing volatility and a possible period of consolidation.
- Volatility Bands: The Volatility Bands have been contracting, suggesting a potential breakout or significant price movement in the near future.
Volume Analysis:
- On-Balance Volume (OBV): The OBV has been fluctuating, indicating mixed sentiment among investors regarding the stock.
- Chaikin Money Flow (CMF): The CMF has been positive but relatively low, suggesting moderate buying pressure.
Conclusion:
Based on the analysis of the technical indicators, the stock of FBCG is likely to experience sideways movement in the next few days. The trend indicators point towards a bullish bias, supported by the moving averages and MACD. However, the momentum indicators, especially the Stochastic Oscillator and Williams %R, suggest a potential pullback or consolidation in the short term. The volatility indicators signal a period of consolidation, while the volume indicators reflect mixed sentiment among investors.
In conclusion, while the overall trend remains bullish, caution is advised due to the conflicting signals from the momentum and volatility indicators. Traders should closely monitor key support and resistance levels for potential entry or exit points, considering the possibility of a short-term correction or consolidation phase.