Technical Analysis of FAZ 2024-05-10
Overview:
In analyzing the technical indicators for FAZ over the last 5 days, we will delve into the trend, momentum, volatility, and volume indicators to provide a comprehensive outlook on the possible stock price movement. By examining these key aspects, we aim to offer valuable insights and predictions for the upcoming trading days.
Trend Analysis:
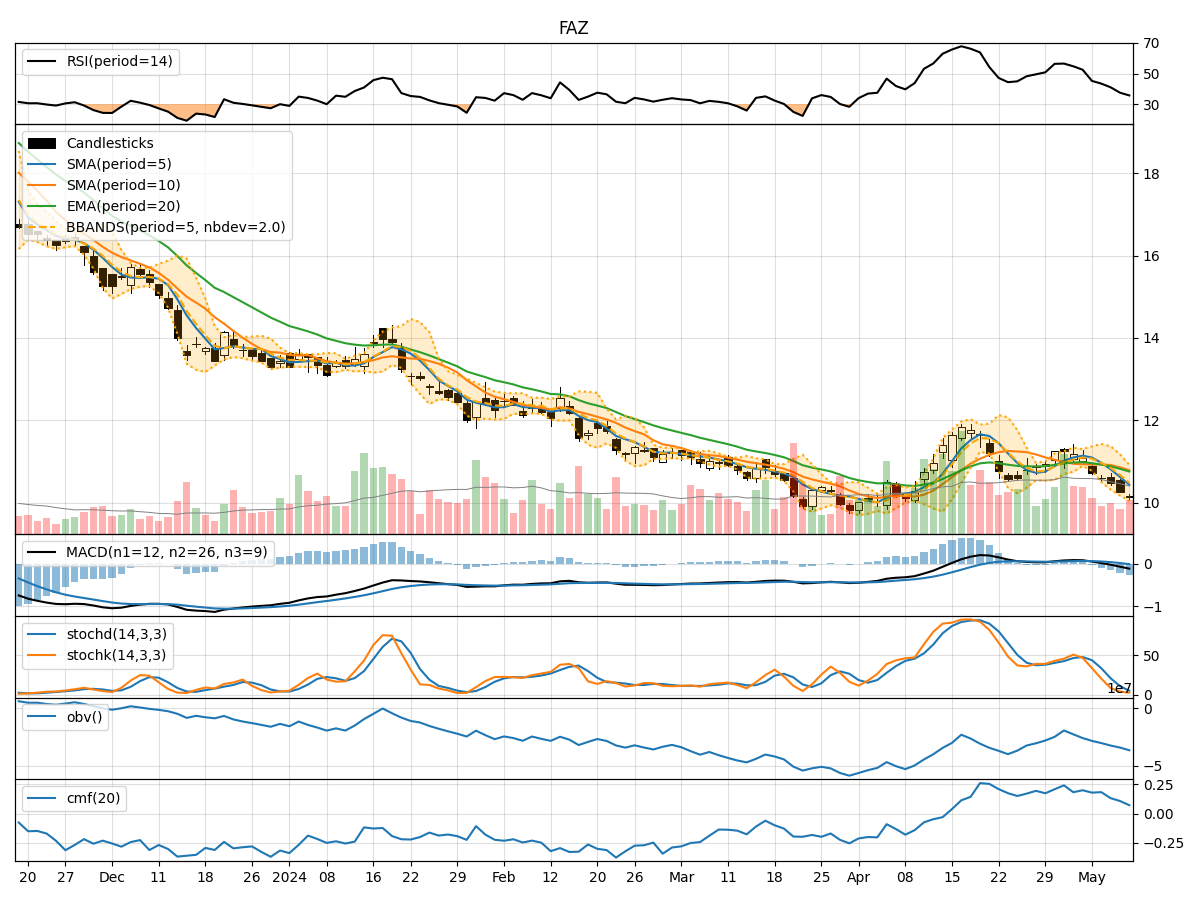
- Moving Averages (MA): The 5-day Moving Average (MA) has been consistently below the Simple Moving Average (SMA) and Exponential Moving Average (EMA), indicating a downward trend.
- MACD: The MACD line has been decreasing, with the MACD line crossing below the signal line, suggesting a bearish momentum.
Momentum Analysis:
- RSI: The Relative Strength Index (RSI) has been declining, indicating weakening momentum.
- Stochastic Oscillator: Both %K and %D have been decreasing, signaling a potential oversold condition.
Volatility Analysis:
- Bollinger Bands (BB): The stock price has been consistently below the middle Bollinger Band (BBM), indicating a lower volatility period.
Volume Analysis:
- On-Balance Volume (OBV): The OBV has been decreasing, suggesting a higher selling pressure.
- Chaikin Money Flow (CMF): The CMF has been declining, indicating a decrease in buying pressure.
Key Observations:
- The trend indicators, momentum indicators, and volume indicators all point towards a bearish sentiment in the market.
- The volatility has been relatively low, indicating a lack of significant price movements.
- The decreasing OBV and CMF suggest a shift towards more selling pressure and a decrease in buying interest.
Conclusion:
Based on the analysis of the technical indicators, the next few days for FAZ are likely to see a continued downward movement in the stock price. The bearish trend, weakening momentum, and increasing selling pressure indicate a challenging period for FAZ. Traders and investors should exercise caution and consider short-term strategies to navigate the anticipated bearish market conditions.