Technical Analysis of EZBC 2024-05-10
Overview:
In the last 5 trading days, EZBC stock has shown mixed signals across various technical indicators. The stock price has fluctuated within a range, accompanied by conflicting trends in momentum, volatility, and volume. As a leading technical analyst, I will delve into each category of indicators to provide a comprehensive analysis and offer insights into the possible future stock price movement for EZBC.
Trend Indicators:
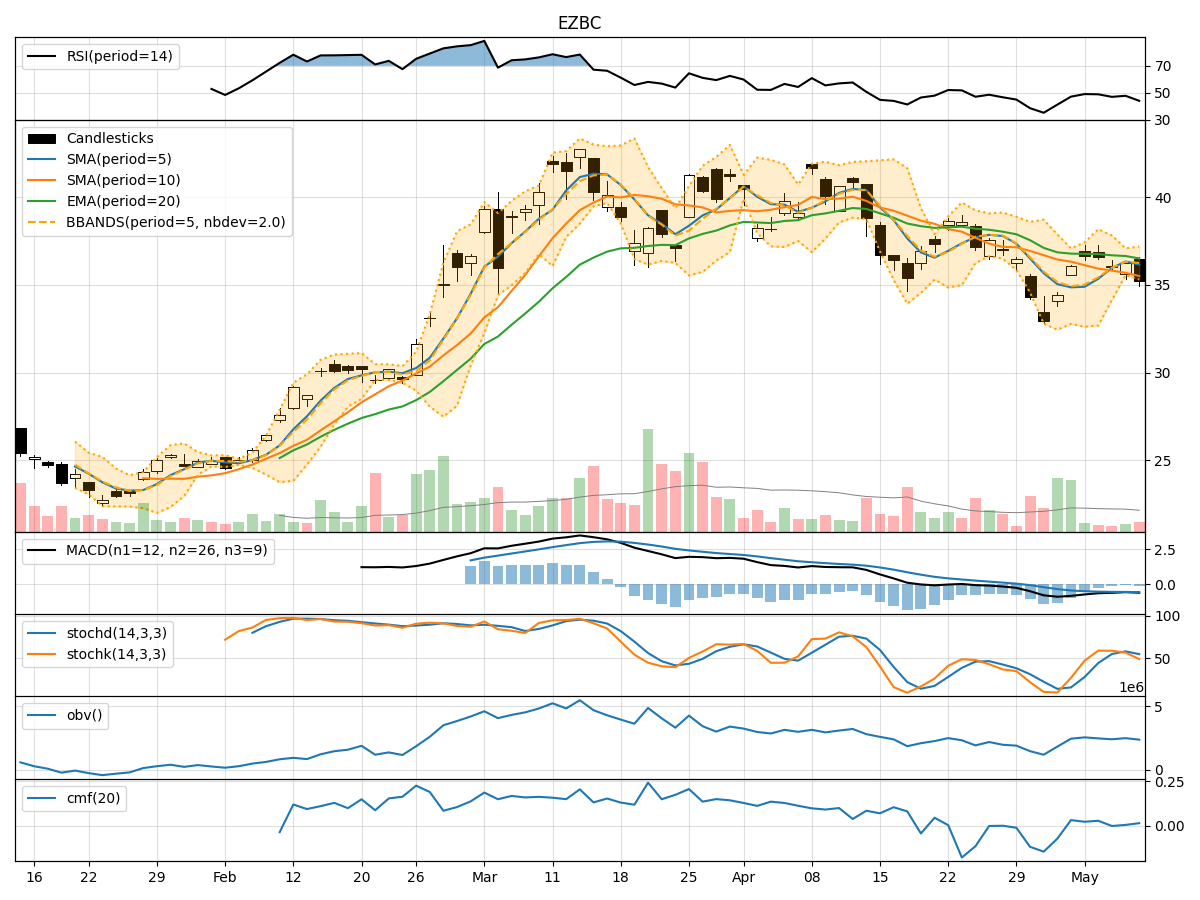
- Moving Averages (MA): The 5-day Moving Average (MA) has been fluctuating around the Simple Moving Average (SMA) and Exponential Moving Average (EMA) values, indicating a lack of clear trend direction.
- MACD: The Moving Average Convergence Divergence (MACD) has been negative, with the MACD line consistently below the signal line, suggesting a bearish momentum.
- RSI: The Relative Strength Index (RSI) has been hovering around the neutral zone, indicating indecision in the market sentiment.
Momentum Indicators:
- Stochastic Oscillator: The Stochastic Oscillator has shown mixed signals, with the %K line fluctuating and the %D line showing some divergence, reflecting uncertainty in momentum.
- Williams %R: The Williams %R has been in oversold territory, suggesting a potential reversal in the short term.
Volatility Indicators:
- Bollinger Bands: The Bollinger Bands have shown narrowing bands, indicating decreasing volatility and a potential period of consolidation.
- Average True Range (ATR): The ATR values have been relatively stable, suggesting a lack of significant price movements.
Volume Indicators:
- On-Balance Volume (OBV): The OBV has shown mixed signals, with no clear trend in volume accumulation or distribution.
- Chaikin Money Flow (CMF): The CMF has been fluctuating around the zero line, indicating a balance between buying and selling pressure.
Key Observations and Opinions:
- Trend: The trend indicators suggest a lack of clear direction, with conflicting signals from moving averages and MACD.
- Momentum: Momentum indicators show mixed signals, with stochastic oscillators indicating uncertainty and Williams %R suggesting a potential reversal.
- Volatility: Volatility indicators point towards a period of consolidation, with Bollinger Bands narrowing and ATR values stabilizing.
- Volume: Volume indicators do not provide a clear indication of strong buying or selling pressure.
Conclusion:
Based on the analysis of the technical indicators, the next few days for EZBC stock are likely to see sideways movement with a potential for consolidation. The lack of clear trends in the trend and momentum indicators, coupled with stable volatility and volume signals, suggests a period of indecision and range-bound trading. Traders and investors should exercise caution and wait for clearer signals before making significant trading decisions.