Technical Analysis of EWJ 2024-05-03
Overview:
In analyzing the technical indicators for EWJ over the last 5 days, we will delve into the trend, momentum, volatility, and volume indicators to provide a comprehensive outlook on the possible stock price movement in the coming days. By examining these key factors, we aim to offer valuable insights and predictions to guide investment decisions.
Trend Indicators:
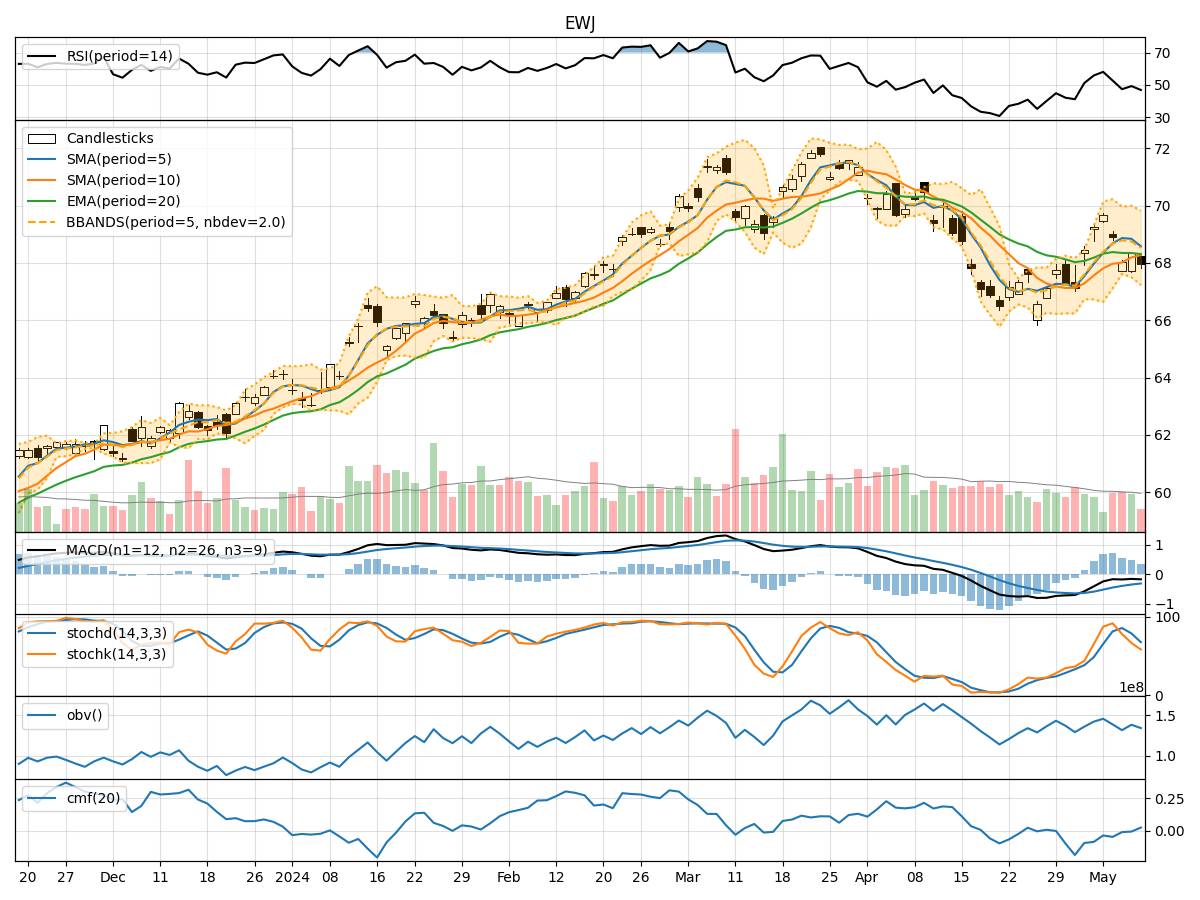
- Moving Averages (MA): The 5-day MA has been fluctuating around the closing prices, indicating short-term price trends. The SMA(10) and EMA(20) show a downward trend, suggesting a bearish sentiment in the medium to long term.
- MACD: The MACD line has been below the signal line, indicating a bearish trend. However, the MACD histogram has shown signs of convergence, hinting at a potential reversal.
- Momentum: The RSI has been below 50, indicating a bearish momentum. The Stochastic indicators have been rising but are not yet in overbought territory.
Volatility Indicators:
- Bollinger Bands (BB): The price has been trading within the bands, suggesting a period of consolidation. The narrowing of the bands indicates decreasing volatility.
- Bollinger %B (BBP): The %B has been hovering around 0.5, indicating a balanced market sentiment.
Volume Indicators:
- On-Balance Volume (OBV): The OBV has been fluctuating, indicating indecision among market participants. The CMF(20) has been negative, reflecting a lack of buying pressure.
Key Observations and Opinions:
- Trend: The trend indicators suggest a bearish sentiment in the medium to long term, with potential signs of a short-term reversal.
- Momentum: The momentum indicators indicate a bearish momentum, but with some signs of potential upward movement.
- Volatility: Volatility has been decreasing, indicating a period of consolidation and potential price stability.
- Volume: The volume indicators show indecision among traders, with a lack of significant buying pressure.
Conclusion:
Based on the analysis of the technical indicators, the overall outlook for EWJ in the next few days leans towards a sideways movement with a slight bullish bias. While the trend and momentum indicators suggest a bearish sentiment, the volatility indicators point towards consolidation, and the volume indicators indicate a lack of strong selling pressure. Traders should monitor for potential signs of a reversal in the short term, but exercise caution due to the prevailing bearish trend in the medium to long term.