Technical Analysis of EUO 2024-05-10
Overview:
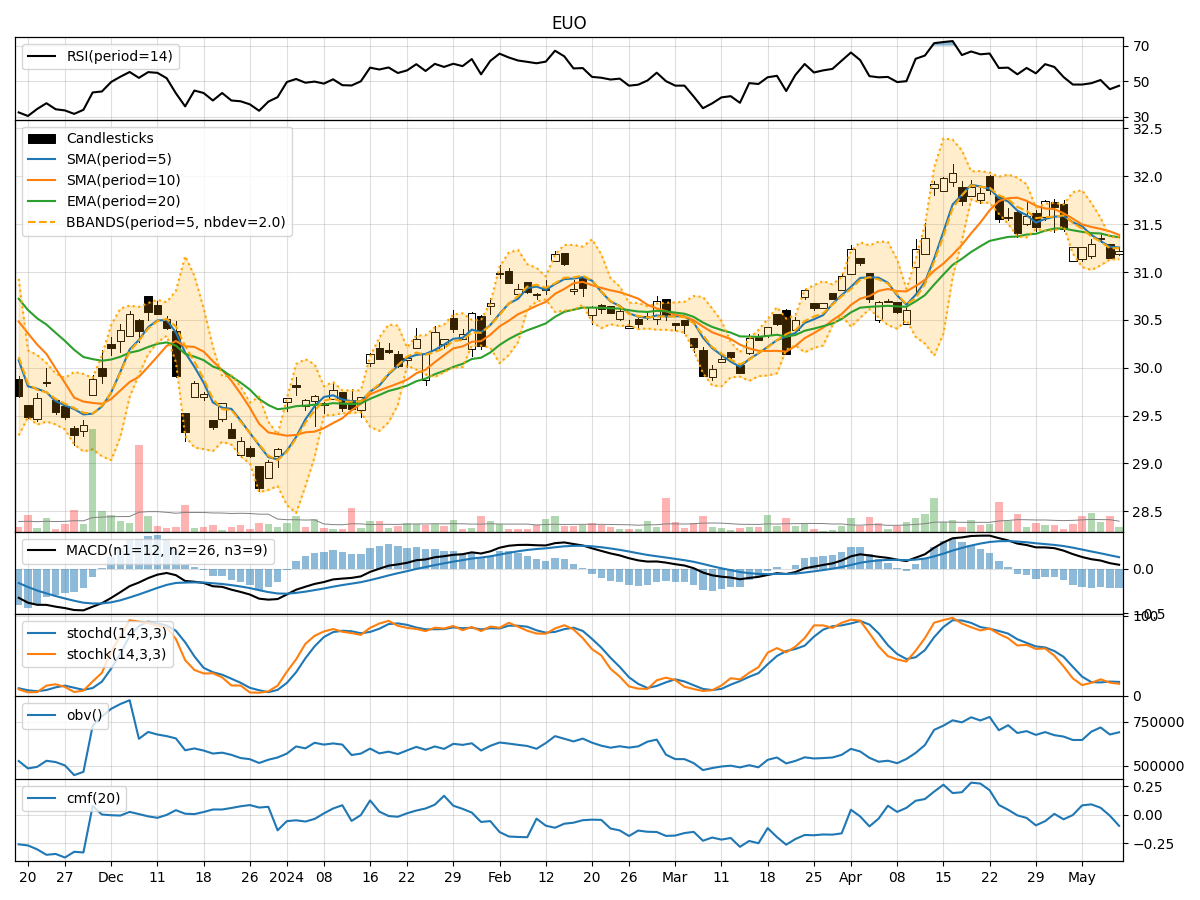
In analyzing the technical indicators for EUO over the last 5 days, we will delve into the trend, momentum, volatility, and volume indicators to provide a comprehensive outlook on the possible stock price movement in the coming days.
Trend Analysis:
- Moving Averages (MA): The 5-day MA has been gradually decreasing, indicating a short-term bearish trend.
- MACD: The MACD line has been consistently below the signal line, suggesting a bearish momentum.
- EMA: The EMA has also been declining, aligning with the bearish sentiment in the short term.
Momentum Analysis:
- RSI: The RSI has been fluctuating around the neutral zone, indicating indecision in the market.
- Stochastic Oscillator: Both %K and %D have been hovering in oversold territory, signaling a potential reversal.
- Williams %R: The indicator has been in oversold territory, suggesting a possible buying opportunity.
Volatility Analysis:
- Bollinger Bands (BB): The bands have been narrowing, indicating decreasing volatility and a potential breakout.
- BB %B: The %B indicator has been fluctuating within a tight range, reflecting consolidation.
Volume Analysis:
- On-Balance Volume (OBV): The OBV has shown mixed signals, with no clear trend in volume accumulation.
- Chaikin Money Flow (CMF): The CMF has been relatively flat, indicating a lack of strong buying or selling pressure.
Key Observations:
- The trend indicators point towards a bearish bias in the short term.
- Momentum indicators suggest a potential reversal or consolidation phase.
- Volatility indicators indicate a potential breakout due to narrowing Bollinger Bands.
- Volume indicators show mixed signals with no clear trend in volume accumulation.
Conclusion:
Based on the analysis of technical indicators, the short-term outlook for EUO appears to be bearish due to the declining moving averages, bearish MACD, and EMA trends. However, the momentum indicators suggest a possible reversal or consolidation phase, while volatility indicators hint at a potential breakout. Volume indicators show mixed signals, indicating uncertainty in volume accumulation. Therefore, while the short-term trend is bearish, traders should closely monitor for potential reversal signals and breakout opportunities in the coming days.