Technical Analysis of ESGA 2024-05-10
Overview:
In analyzing the technical indicators for ESGA over the last 5 days, we will delve into the trend, momentum, volatility, and volume indicators to provide a comprehensive outlook on the possible stock price movement. By examining these key factors, we aim to offer valuable insights and predictions for the upcoming trading days.
Trend Analysis:
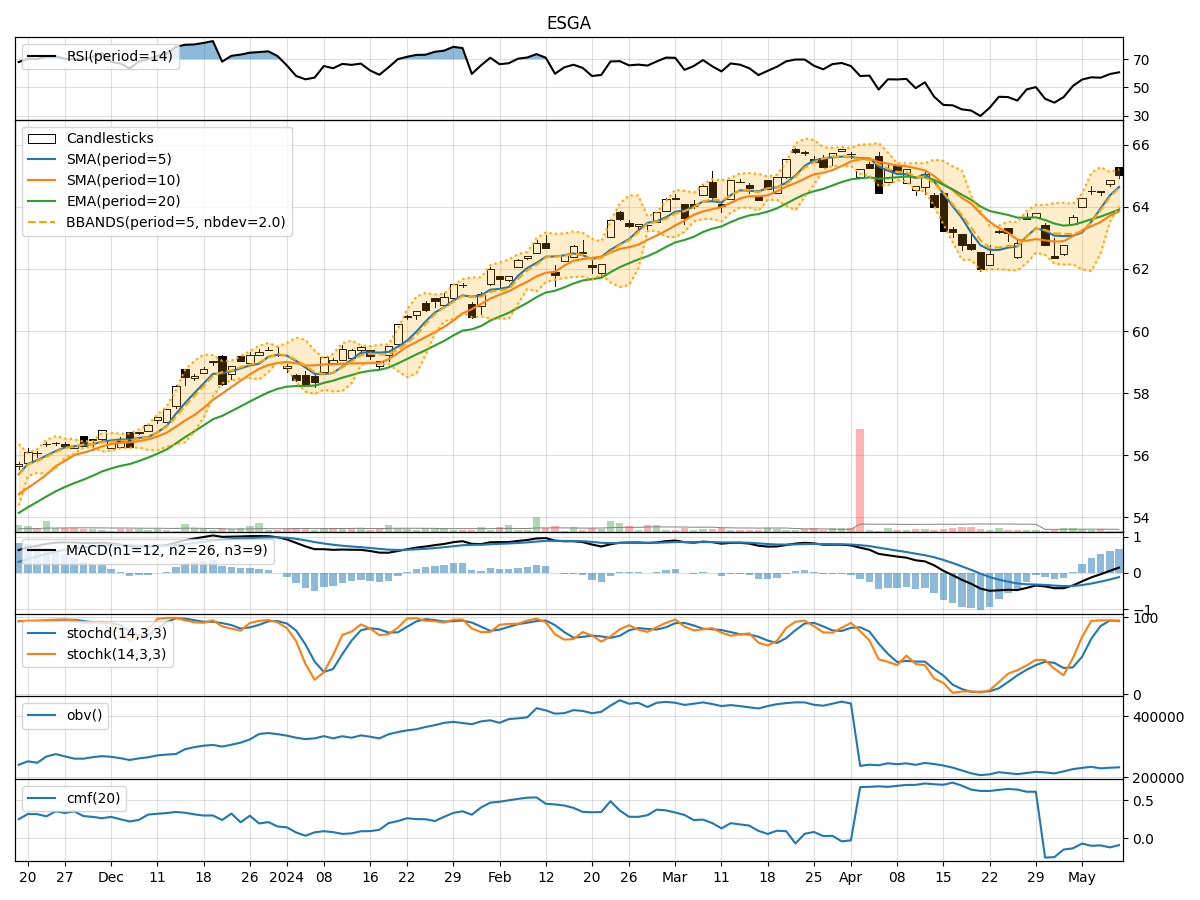
- Moving Averages (MA): The 5-day Moving Average has been consistently above the Simple Moving Average (SMA) and Exponential Moving Average (EMA), indicating a bullish trend.
- MACD: The MACD line has been consistently above the signal line, with the MACD Histogram showing an increasing positive trend, suggesting bullish momentum.
Momentum Analysis:
- RSI: The Relative Strength Index (RSI) has been trending upwards, indicating increasing buying pressure.
- Stochastic Oscillator: Both %K and %D have been in the overbought zone, suggesting a strong bullish momentum.
- Williams %R: The Williams %R has been consistently in the oversold territory, indicating a potential reversal to the upside.
Volatility Analysis:
- Bollinger Bands: The stock price has been consistently trading above the middle Bollinger Band (BBM), indicating an upward trend with low volatility.
- Bollinger %B: The %B indicator has been above 0.5, suggesting a bullish trend.
Volume Analysis:
- On-Balance Volume (OBV): The OBV has been showing a slight decrease, indicating some distribution happening in the stock.
- Chaikin Money Flow (CMF): The CMF has been negative, suggesting a bearish sentiment in the stock.
Conclusion:
Based on the analysis of the technical indicators, the stock of ESGA is bullish in the short term. The trend indicators, momentum oscillators, and volatility indicators all point towards a potential upward movement in the stock price. However, the slight decrease in OBV and negative CMF signal some caution as there might be some profit-taking or distribution happening.
Recommendation:
Considering the overall bullish sentiment in the technical indicators, it is advisable to consider buying ESGA for potential short-term gains. Traders should closely monitor the price action and key support/resistance levels to capitalize on the anticipated upward movement. It is essential to set stop-loss orders to manage risk effectively and stay updated on any new developments that may impact the stock price.