Technical Analysis of EQUL 2024-05-10
Overview:
In analyzing the provided technical indicators for the last 5 days, we will delve into the trend, momentum, volatility, and volume indicators to forecast the possible stock price movement for the next few days. By examining these key aspects, we aim to provide a comprehensive and insightful prediction backed by data-driven analysis.
Trend Indicators:
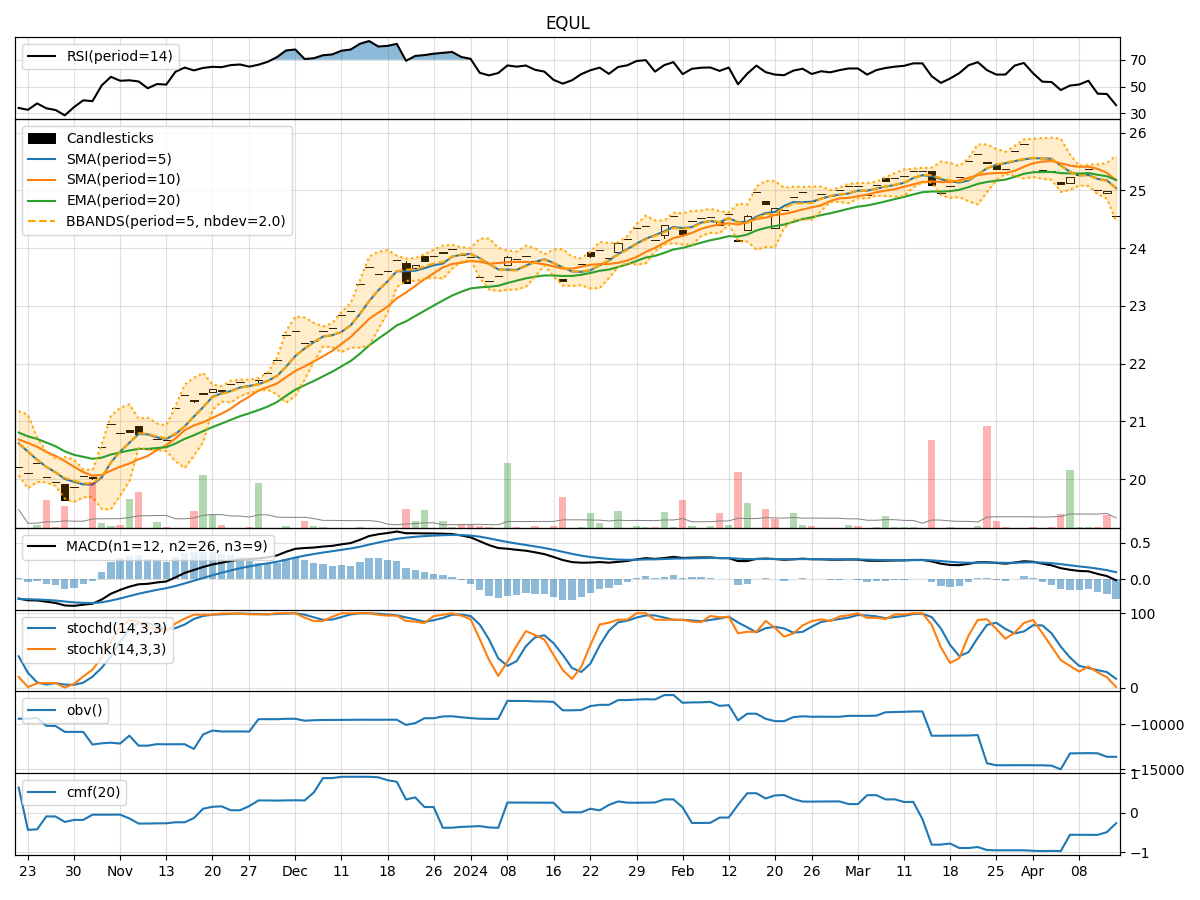
- Moving Averages (MA): The 5-day MA has been consistently above the closing prices, indicating a potential bullish trend.
- MACD: The MACD line has been gradually increasing, with the MACD histogram showing positive values, suggesting a strengthening bullish momentum.
- RSI: The RSI values have been fluctuating around the neutral zone, indicating a balanced market sentiment.
Momentum Indicators:
- Stochastic Oscillator: Both %K and %D values have been in the overbought territory, signaling a potential reversal or consolidation.
- Williams %R: The Williams %R indicator has been hovering around the oversold region, suggesting a possible buying opportunity.
Volatility Indicators:
- Bollinger Bands (BB): The stock price has been trading within the bands, indicating a period of consolidation.
- BB% (Bollinger Band %B): The %B value has been fluctuating around 0.8, suggesting a moderate level of volatility.
Volume Indicators:
- On-Balance Volume (OBV): The OBV values have been negative, indicating a net selling pressure in the market.
- Chaikin Money Flow (CMF): The CMF values have been positive but decreasing, signaling a potential weakening of buying pressure.
Conclusion:
Based on the analysis of the technical indicators, the stock is likely to experience sideways movement in the next few days. The bullish momentum indicated by the moving averages and MACD may be offset by the overbought conditions highlighted by the stochastic oscillator. The volatility is expected to remain moderate, as depicted by the Bollinger Bands, while the volume suggests a slight bias towards selling pressure.
In conclusion, while there are indications of bullish sentiment in the trend and momentum indicators, caution is advised due to the overbought levels and selling pressure in the market. Traders should closely monitor key support and resistance levels for potential entry or exit points, considering the overall market dynamics and potential reversals.