Technical Analysis of EMTL 2024-05-10
Overview:
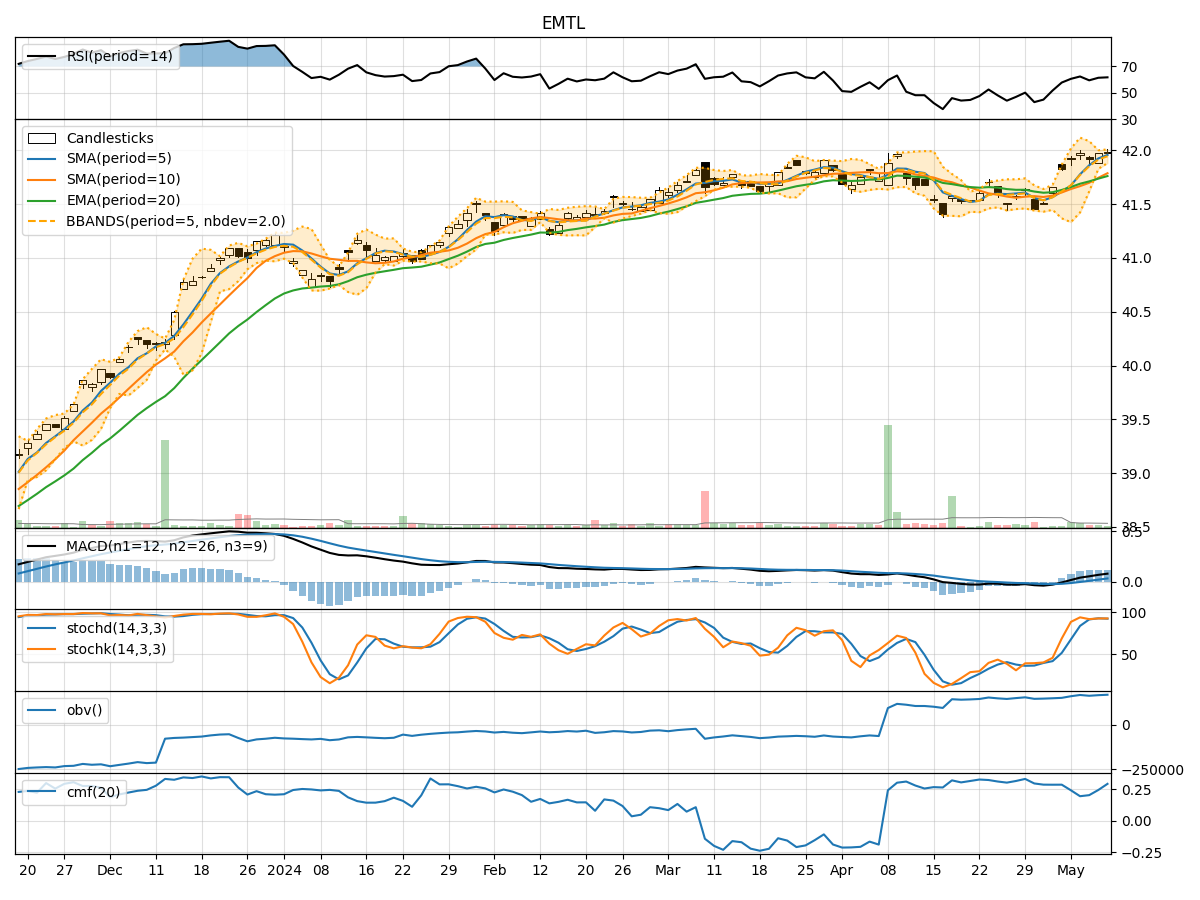
In analyzing the technical indicators for EMTL over the last 5 days, we will delve into the trend, momentum, volatility, and volume indicators to provide a comprehensive outlook on the possible stock price movement in the coming days. By examining these key aspects, we aim to offer valuable insights and recommendations for potential investors.
Trend Analysis:
- Moving Averages (MA): The 5-day Moving Average (MA) has been consistently above the Simple Moving Average (SMA) and Exponential Moving Average (EMA), indicating a bullish trend.
- MACD: The MACD line has been consistently above the signal line, with both lines showing an upward trend, suggesting bullish momentum.
- RSI: The Relative Strength Index (RSI) has been hovering around 60-62, indicating a neutral stance in terms of overbought or oversold conditions.
Momentum Analysis:
- Stochastic Oscillator: Both %K and %D lines of the Stochastic Oscillator have been relatively high, indicating strong upward momentum.
- Williams %R: The Williams %R is close to the oversold territory, suggesting a potential reversal or consolidation.
Volatility Analysis:
- Bollinger Bands (BB): The stock price has been trading within the Bollinger Bands, with the bands narrowing, indicating decreasing volatility.
- BB %B: The %B indicator is above 0.5, suggesting a bullish sentiment in the short term.
Volume Analysis:
- On-Balance Volume (OBV): The OBV has shown a slight increase over the last 5 days, indicating accumulation by investors.
- Chaikin Money Flow (CMF): The CMF has been positive, reflecting buying pressure in the stock.
Key Observations:
- The trend indicators suggest a strong bullish sentiment, supported by the MACD and moving averages.
- Momentum indicators indicate a continuation of the current upward momentum, with a potential for a short-term consolidation based on the Williams %R.
- Volatility has been decreasing, which could lead to a period of consolidation or a minor pullback.
- Volume indicators show a slight increase in buying pressure, supporting the bullish outlook.
Conclusion:
Based on the analysis of the technical indicators, the next few days for EMTL are likely to see continued upward movement in the stock price. The overall trend is bullish, supported by strong momentum and positive volume indicators. While a short-term consolidation or pullback cannot be ruled out due to decreasing volatility, the overall outlook remains bullish. Investors may consider maintaining or initiating long positions in EMTL based on the current technical analysis.