Technical Analysis of ELQD 2024-05-10
Overview:
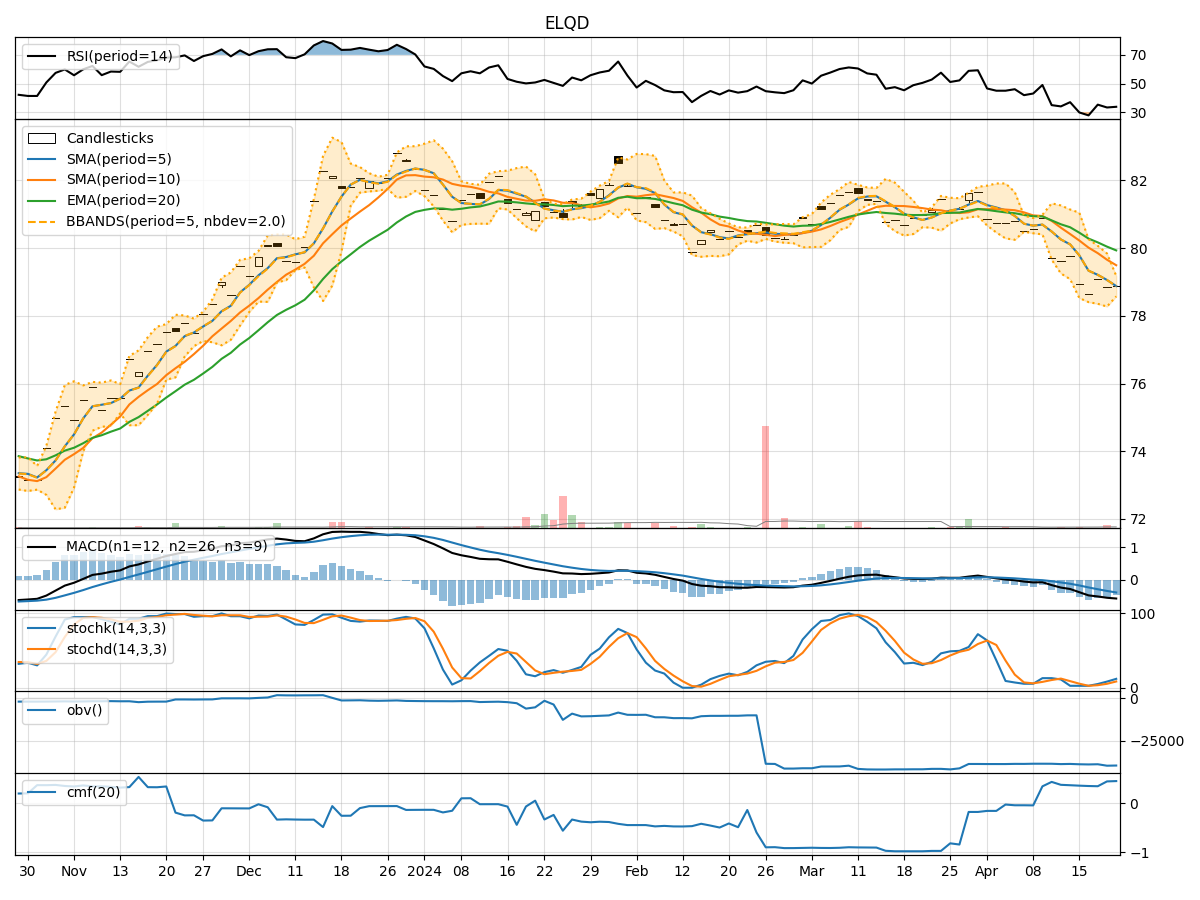
In analyzing the technical indicators for ELQD over the last 5 days, we will delve into the trend, momentum, volatility, and volume indicators to provide a comprehensive outlook on the possible stock price movement. By examining these key aspects, we aim to offer valuable insights and predictions for the upcoming trading days.
Trend Analysis:
- Moving Averages (MA): The 5-day Moving Average (MA) has been consistently above the Simple Moving Average (SMA) and Exponential Moving Average (EMA), indicating a bullish trend.
- MACD: The MACD line has been above the signal line, with both lines showing an upward trend, suggesting positive momentum.
- MACD Histogram: The MACD Histogram has been increasing, indicating strengthening bullish momentum.
Momentum Analysis:
- RSI: The Relative Strength Index (RSI) has been fluctuating around the neutral zone, suggesting a balanced momentum.
- Stochastic Oscillator: Both %K and %D have been gradually decreasing but remain in the overbought territory, indicating a potential reversal.
- Williams %R: The Williams %R has been in the oversold region, signaling a possible buying opportunity.
Volatility Analysis:
- Bollinger Bands (BB): The stock price has been trading within the Bollinger Bands, with the bands narrowing, indicating decreasing volatility.
- Bollinger %B: The %B indicator has been hovering around the middle range, suggesting a neutral stance in terms of volatility.
Volume Analysis:
- On-Balance Volume (OBV): The OBV has been fluctuating, indicating indecision among investors regarding the stock.
- Chaikin Money Flow (CMF): The CMF has been negative, reflecting selling pressure in the market.
Key Observations:
- The trend indicators suggest a bullish sentiment, supported by the MACD and moving averages.
- Momentum indicators show a mixed outlook, with RSI indicating neutrality and Stochastic Oscillator hinting at a potential reversal.
- Volatility has been decreasing, as seen in the narrowing Bollinger Bands.
- Volume indicators reflect uncertainty, with OBV fluctuating and CMF signaling selling pressure.
Conclusion:
Based on the analysis of the technical indicators, the stock price of ELQD is likely to experience further upward movement in the next few days. The bullish trend indicated by the moving averages and MACD, coupled with decreasing volatility, supports a positive outlook. However, investors should remain cautious of the mixed momentum signals and the uncertainty in volume indicators. Overall, the bullish sentiment is expected to prevail in the near term, with potential for higher stock prices in the coming days.