Technical Analysis of EDV 2024-05-10
Overview:
In analyzing the technical indicators for EDV over the last 5 days, we will delve into the trend, momentum, volatility, and volume indicators to provide a comprehensive outlook on the possible stock price movement in the coming days. By examining these key aspects, we aim to offer valuable insights and recommendations for your investment decisions.
Trend Analysis:
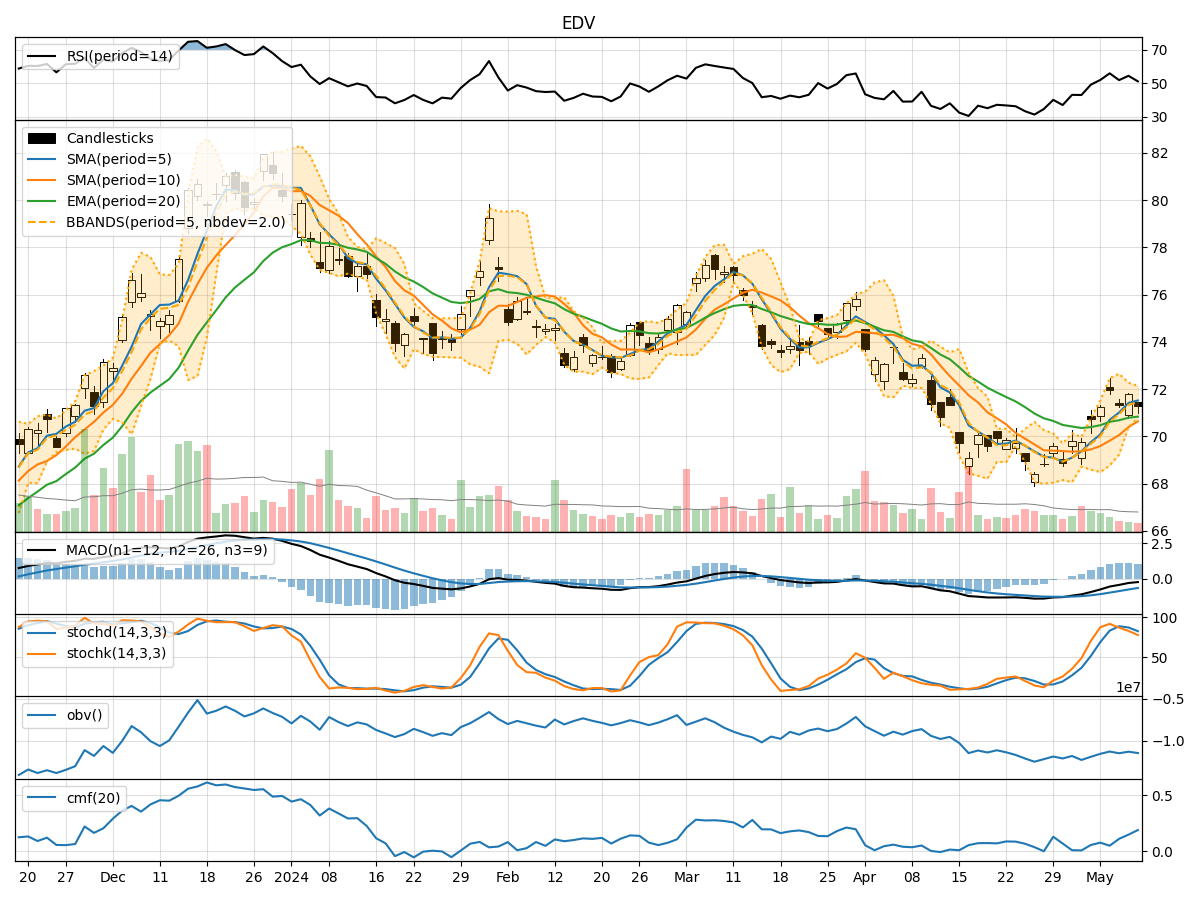
- Moving Averages (MA): The 5-day Moving Average (MA) has been consistently above the Simple Moving Average (SMA) and Exponential Moving Average (EMA), indicating a bullish trend.
- MACD: The MACD line has been negative but showing signs of convergence towards the signal line, suggesting a potential bullish crossover.
- MACD Histogram: The MACD Histogram has been gradually decreasing but remains in positive territory, indicating a weakening bullish momentum.
Momentum Analysis:
- RSI: The Relative Strength Index (RSI) has been fluctuating around the midline, indicating a lack of strong momentum in either direction.
- Stochastic Oscillator: Both %K and %D have been declining, suggesting a potential bearish momentum.
- Williams %R: The Williams %R is in oversold territory, indicating a possible reversal to the upside.
Volatility Analysis:
- Bollinger Bands: The stock price has been trading within the Bollinger Bands, with the bands narrowing, indicating decreasing volatility.
- Bollinger %B: The %B indicator is below 1, suggesting the price is closer to the lower band, potentially signaling a buying opportunity.
Volume Analysis:
- On-Balance Volume (OBV): The OBV has been fluctuating but generally trending downwards, indicating selling pressure.
- Chaikin Money Flow (CMF): The CMF has been positive, suggesting accumulation by investors despite the downward trend in OBV.
Conclusion:
Based on the analysis of the technical indicators, the stock price of EDV is likely to experience sideways consolidation in the next few days. The bullish signals from the moving averages and MACD are countered by the lack of strong momentum indicated by RSI and Stochastic Oscillator. The narrowing Bollinger Bands and decreasing OBV point towards a period of consolidation with a potential for a slight upward bias. Investors should closely monitor key support and resistance levels for potential breakout opportunities.
Key Takeaways:
- Trend: Bullish
- Momentum: Neutral to Bearish
- Volatility: Decreasing
- Volume: Slightly Bearish
Recommendation:
Considering the mixed signals from the technical indicators, it is advisable to exercise caution and wait for a clearer trend confirmation before making significant trading decisions. Keep a close eye on key levels and be prepared to act swiftly in response to any breakout or reversal signals.