Technical Analysis of ECOW 2024-05-31
Overview:
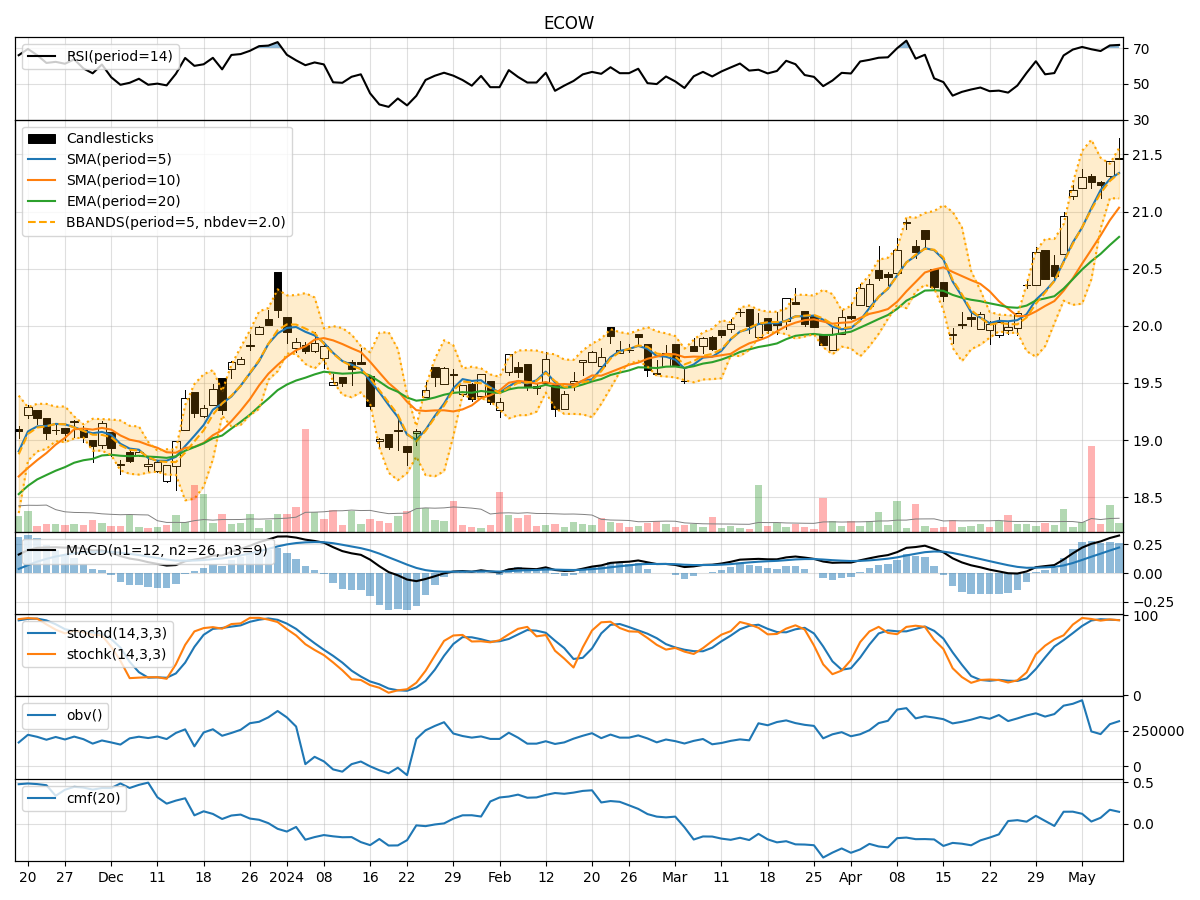
In analyzing the technical indicators for ECOW stock over the last 5 days, we will delve into the trend, momentum, volatility, and volume indicators to provide a comprehensive outlook on the possible stock price movement in the coming days. By examining these key indicators, we aim to offer valuable insights and predictions to guide investment decisions.
Trend Analysis:
- Moving Averages (MA): The 5-day Moving Average (MA) has been gradually decreasing from 21.864 to 21.626, indicating a downward trend in the stock price.
- MACD: The MACD line has been consistently positive, suggesting bullish momentum in the short term.
- EMA: The Exponential Moving Average (EMA) has shown a slight decline but remains above the current price, indicating potential support levels.
Key Observation: The trend indicators suggest a short-term bearish sentiment in the stock price.
Momentum Analysis:
- RSI: The Relative Strength Index (RSI) has been decreasing, indicating a weakening momentum in the stock.
- Stochastic Oscillator: Both %K and %D have been declining, signaling a potential oversold condition.
- Williams %R: The Williams %R is in the oversold territory, suggesting a possible reversal in the stock price.
Key Observation: Momentum indicators point towards a potential reversal or consolidation in the stock price.
Volatility Analysis:
- Bollinger Bands: The Bollinger Bands have been narrowing, indicating decreasing volatility in the stock price.
- Bollinger %B: The %B indicator is hovering around 0.1, suggesting the stock is nearing oversold conditions.
Key Observation: Volatility indicators imply a period of consolidation or a potential breakout in the stock price.
Volume Analysis:
- On-Balance Volume (OBV): The OBV has been declining, indicating selling pressure in the stock.
- Chaikin Money Flow (CMF): The CMF has been relatively stable, suggesting a neutral money flow in the stock.
Key Observation: Volume indicators reflect a bearish sentiment with increasing selling pressure.
Conclusion:
Based on the analysis of the technical indicators, the next few days' possible stock price movement for ECOW is likely to be bearish in the short term. The trend indicators show a downward trajectory, while momentum indicators suggest a potential reversal or consolidation. Volatility indicators point towards a period of consolidation or a breakout, and volume indicators indicate increasing selling pressure.
Overall Outlook: Bearish with a potential for consolidation before a possible reversal. Traders should exercise caution and consider waiting for confirmation signals before making any significant trading decisions.