Technical Analysis of DYLD 2024-05-10
Overview:
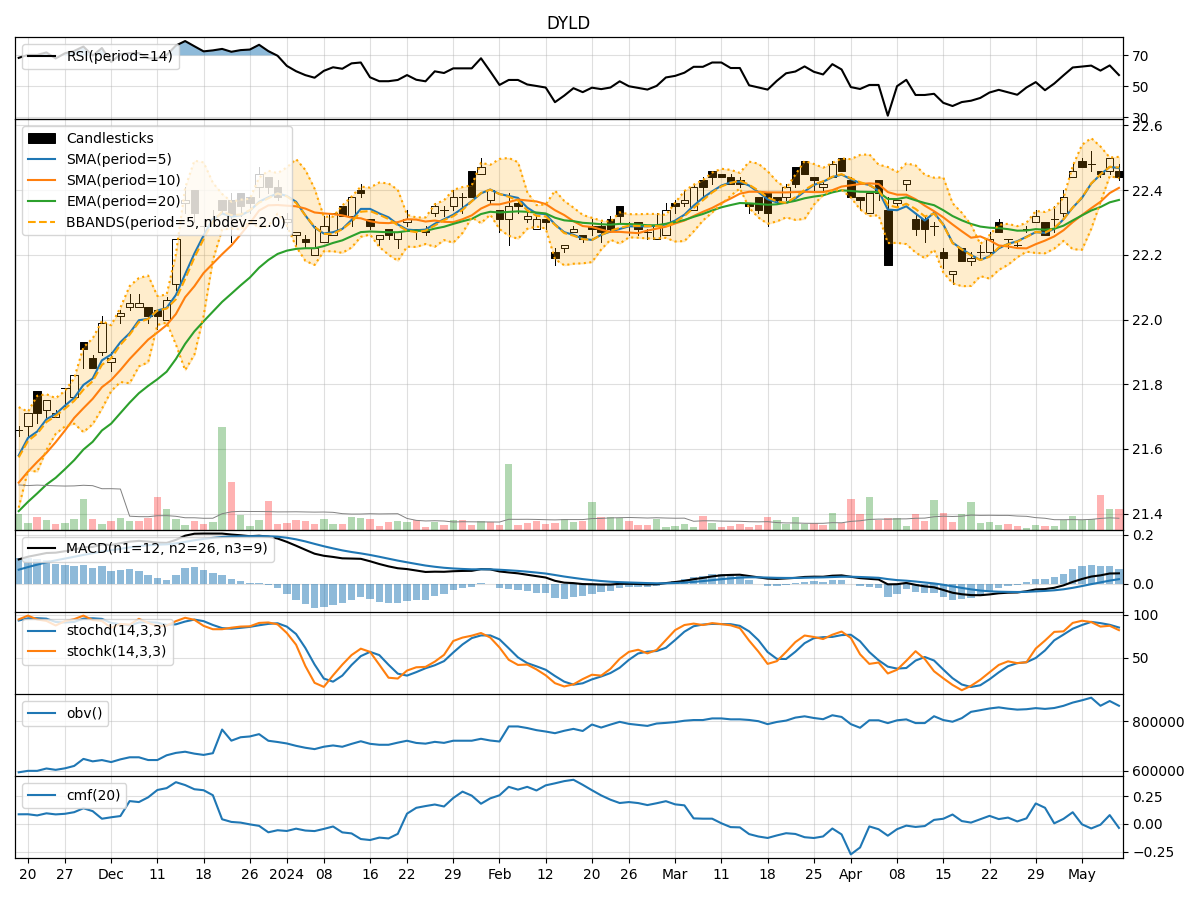
In analyzing the technical indicators for DYLD stock over the last 5 days, we will delve into the trends, momentum, volatility, and volume aspects to provide a comprehensive outlook on the possible future stock price movement. By examining key indicators such as moving averages, MACD, RSI, Bollinger Bands, and OBV, we aim to offer valuable insights and predictions for the upcoming trading days.
Trend Analysis:
- Moving Averages (MA): The 5-day MA has been consistently above the closing prices, indicating a short-term uptrend.
- MACD: The MACD line has been above the signal line for the past 5 days, suggesting bullish momentum.
- EMA: The EMA(20) has been steadily increasing, supporting the bullish trend.
Key Observation: The trend indicators point towards a bullish sentiment in the short term.
Momentum Analysis:
- RSI: The RSI values have been fluctuating around the overbought territory, indicating strong buying pressure.
- Stochastic Oscillator: Both %K and %D have been relatively high, signaling potential overbought conditions.
- Williams %R: The indicator has been consistently in the oversold region, suggesting a possible reversal.
Key Observation: Momentum indicators reflect a mixed sentiment with signs of overbought conditions.
Volatility Analysis:
- Bollinger Bands: The stock price has mostly stayed within the bands, indicating moderate volatility.
- Bollinger %B: The %B values have fluctuated around the midline, suggesting a balanced market sentiment.
Key Observation: Volatility indicators suggest a stable market with no extreme price movements expected.
Volume Analysis:
- On-Balance Volume (OBV): The OBV has shown mixed movements, indicating indecision among investors.
- Chaikin Money Flow (CMF): The CMF(20) has been negative, suggesting outflow of money from the stock.
Key Observation: Volume indicators imply a neutral stance with no clear direction in investor sentiment.
Conclusion:
Based on the analysis of trend, momentum, volatility, and volume indicators, the next few days for DYLD stock are likely to see continued bullish momentum in the short term. However, the mixed momentum signals and neutral volume indicators suggest a potential for consolidation or a minor pullback in the near future. Traders should closely monitor key support and resistance levels for potential entry or exit points.
Recommendation:
- Short-term Traders: Consider taking long positions with tight stop-loss levels to capitalize on the bullish momentum.
- Long-term Investors: Monitor the price action closely for potential entry points during any pullbacks for a more favorable risk-reward ratio.
In conclusion, while the overall outlook remains bullish in the short term, it is essential to stay vigilant and adapt to changing market conditions to make informed trading decisions.