Technical Analysis of DUST 2024-05-10
Overview:
In analyzing the technical indicators for DUST over the last 5 days, we will delve into the trend, momentum, volatility, and volume indicators to provide a comprehensive outlook on the possible stock price movement in the coming days. By examining these key indicators, we aim to offer valuable insights and recommendations for potential investors.
Trend Analysis:
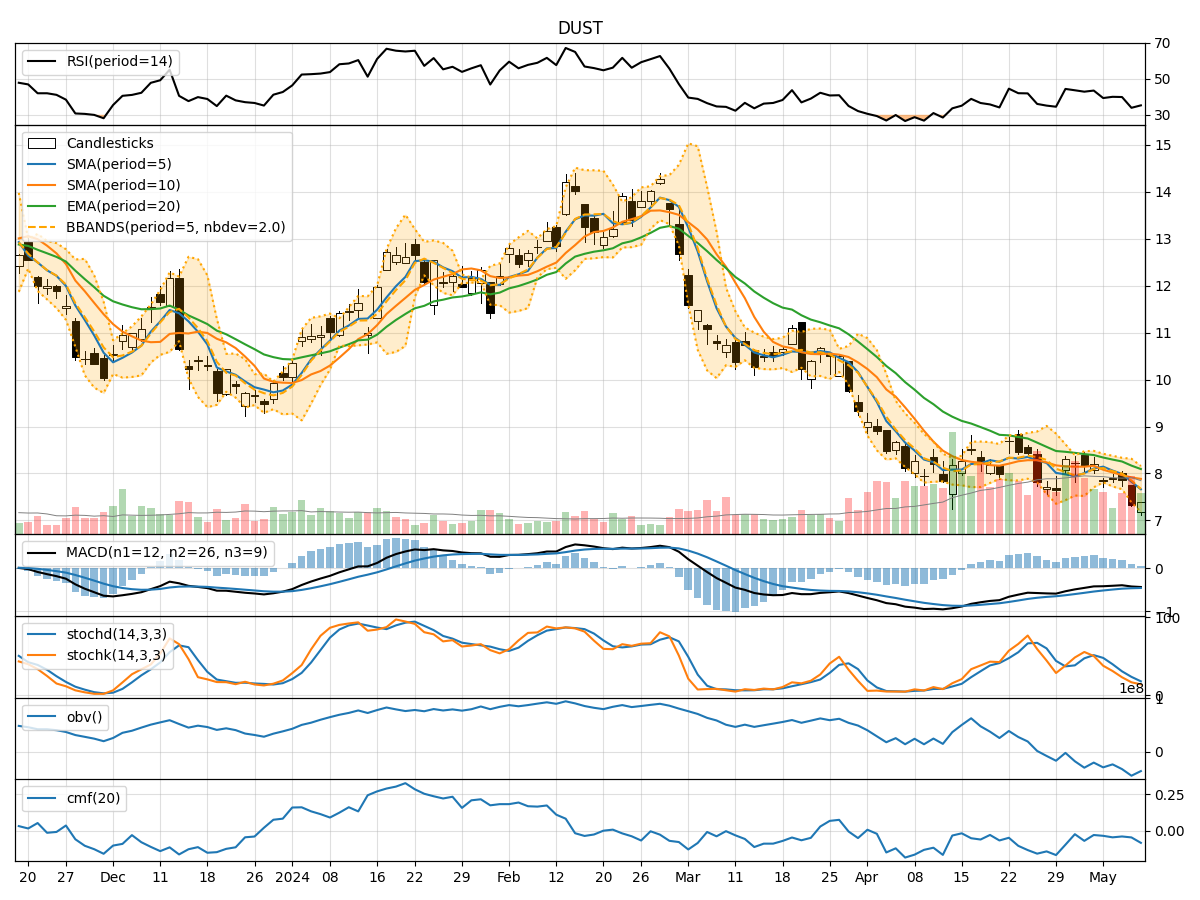
- Moving Averages (MA): The 5-day Moving Average (MA) has been consistently below the Simple Moving Average (SMA) and Exponential Moving Average (EMA) over the past 5 days, indicating a downward trend in the stock price.
- MACD: The Moving Average Convergence Divergence (MACD) has been negative, with the MACD line below the signal line, suggesting bearish momentum in the stock.
- Conclusion: The trend indicators point towards a downward trajectory for DUST in the near term.
Momentum Analysis:
- RSI: The Relative Strength Index (RSI) has been hovering around 30-40, indicating a slightly oversold condition but not yet reaching extreme levels.
- Stochastic Oscillator: Both %K and %D have been in the oversold territory, suggesting a potential reversal or bounce in the stock price.
- Conclusion: The momentum indicators signal a potential reversal or short-term bounce in DUST's stock price.
Volatility Analysis:
- Bollinger Bands: The stock price has been trading within the lower Bollinger Band (BB) range, indicating a period of low volatility and potential consolidation.
- Conclusion: Volatility indicators suggest a consolidation phase for DUST, with a possible range-bound movement in the coming days.
Volume Analysis:
- On-Balance Volume (OBV): The OBV has been consistently negative, indicating selling pressure and a bearish sentiment in the stock.
- Chaikin Money Flow (CMF): The CMF has been negative, reflecting a lack of buying interest in DUST.
- Conclusion: Volume indicators support a bearish outlook for DUST, with selling pressure dominating the market sentiment.
Overall Conclusion:
Based on the analysis of trend, momentum, volatility, and volume indicators, the overall outlook for DUST in the next few days is bearish. The trend indicators suggest a continued downward trajectory, while momentum indicators hint at a potential short-term bounce. Volatility indicators point towards consolidation, and volume indicators reinforce the bearish sentiment.
Recommendation:
Considering the comprehensive analysis of technical indicators, investors should exercise caution when trading DUST in the near term. It is advisable to wait for confirmation of a reversal or a clear uptrend before considering any long positions. Short-term traders may find opportunities to capitalize on potential bounces within the prevailing downtrend, but risk management is crucial in such volatile market conditions.
Disclaimer:
This analysis is based solely on technical indicators and historical price data. Market dynamics can change rapidly, and unforeseen events may impact stock prices. It is essential to conduct thorough research, consider fundamental factors, and consult with a financial advisor before making any investment decisions.