Technical Analysis of DULL 2024-05-10
Overview:
In analyzing the technical indicators for the stock DULL over the last 5 days, we will delve into the trends, momentum, volatility, and volume indicators to provide a comprehensive outlook on the possible future stock price movement. By examining these key indicators, we aim to offer valuable insights and predictions for the upcoming trading days.
Trend Indicators:
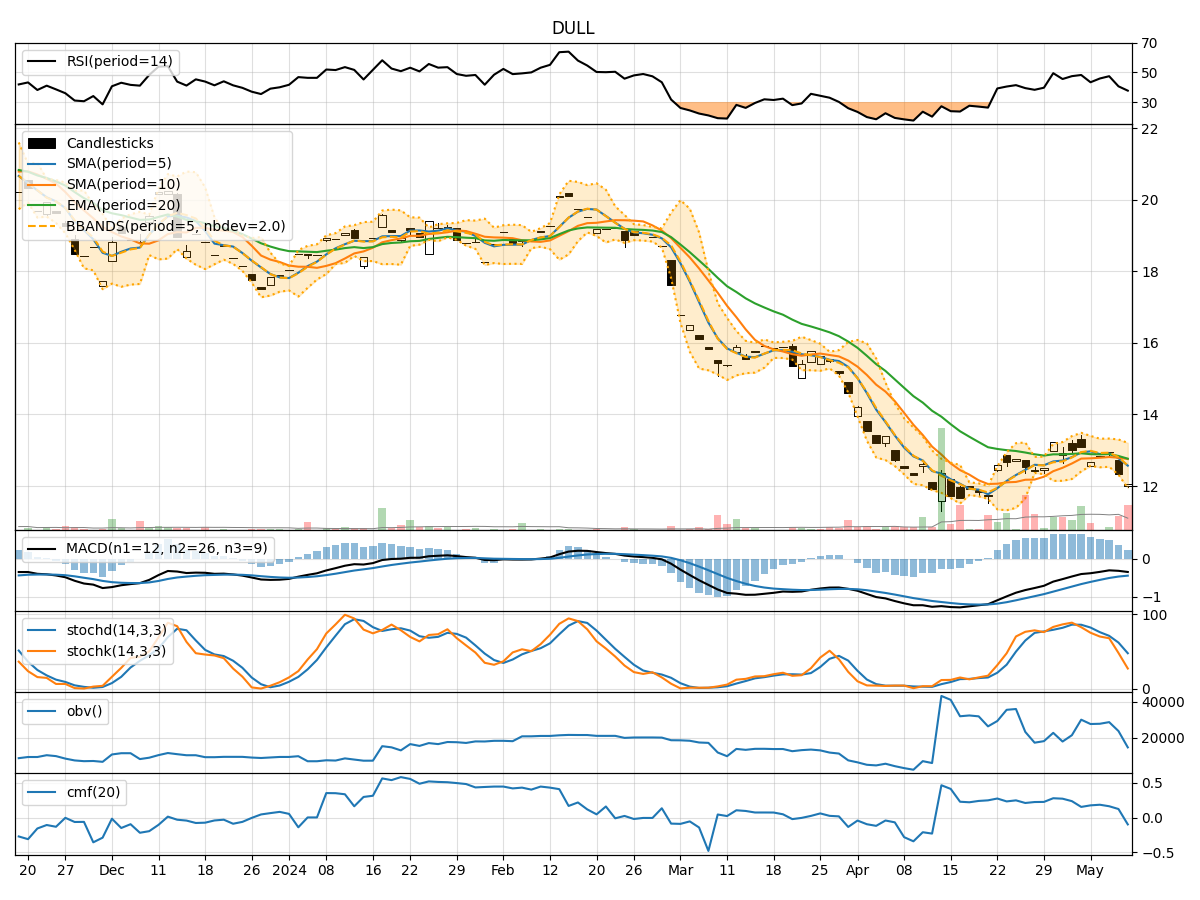
- Moving Averages (MA): The 5-day Moving Average (MA) has been declining, indicating a short-term bearish trend.
- MACD: The MACD line has been consistently below the signal line, suggesting a bearish momentum in the stock price.
- MACD Histogram: The MACD Histogram has been decreasing, further confirming the bearish sentiment in the stock.
Momentum Indicators:
- RSI: The Relative Strength Index (RSI) has been trending downwards, reflecting a weakening momentum in the stock.
- Stochastic Oscillator: Both %K and %D of the Stochastic Oscillator have been decreasing, indicating a bearish momentum.
- Williams %R: The Williams %R is in the oversold territory, signaling a potential reversal or continuation of the downtrend.
Volatility Indicators:
- Bollinger Bands: The Bollinger Bands are narrowing, suggesting a decrease in volatility and a possible period of consolidation.
- Bollinger %B: The %B indicator is below 0.2, indicating that the stock is trading near the lower band and may be oversold.
Volume Indicators:
- On-Balance Volume (OBV): The OBV has been fluctuating, indicating indecision among investors regarding the stock.
- Chaikin Money Flow (CMF): The CMF has been declining, suggesting that money may be flowing out of the stock.
Key Observations and Opinions:
- The stock DULL is currently in a bearish trend based on the moving averages and MACD indicators.
- Momentum indicators such as RSI and Stochastic Oscillator support the bearish sentiment with downward trends.
- Volatility indicators point towards a potential period of consolidation as the Bollinger Bands narrow.
- Volume indicators show mixed signals with OBV fluctuating and CMF declining, indicating uncertainty among investors.
Conclusion:
Based on the analysis of the technical indicators, the next few days for DULL stock are likely to see further downward movement. The bearish trend supported by moving averages, MACD, RSI, and Stochastic Oscillator suggests that sellers are in control of the market. The narrowing Bollinger Bands indicate a potential consolidation phase, while the mixed volume indicators imply a lack of strong conviction from market participants. Therefore, it is advisable to exercise caution and consider a bearish outlook for DULL stock in the upcoming trading sessions.