Technical Analysis of DOL 2024-05-10
Overview:
In analyzing the technical indicators for DOL stock over the last 5 days, we will delve into the trend, momentum, volatility, and volume indicators to provide a comprehensive outlook on the possible stock price movement in the coming days. By examining these key indicators, we aim to offer valuable insights and predictions for informed decision-making.
Trend Analysis:
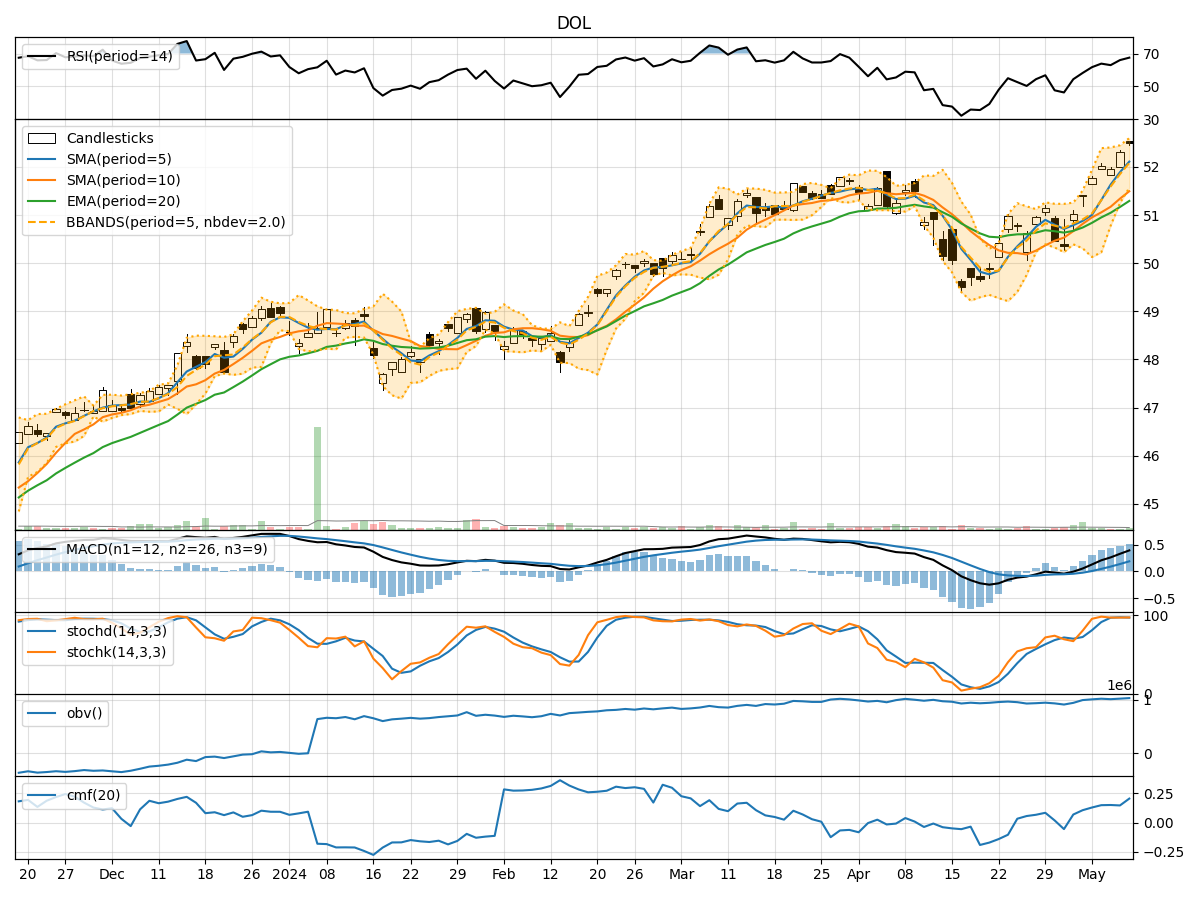
- Moving Averages (MA): The 5-day Moving Average (MA) has been consistently rising, indicating a bullish trend in the short term.
- MACD: The MACD line has been above the signal line, suggesting positive momentum in the stock price.
- RSI: The Relative Strength Index (RSI) has been trending upwards, reflecting increasing buying pressure.
Momentum Analysis:
- Stochastic Oscillator: Both %K and %D have been in the overbought zone, signaling a potential reversal or consolidation.
- Williams %R: The Williams %R indicator has been consistently in the oversold territory, indicating a possible reversal in the stock price.
Volatility Analysis:
- Bollinger Bands (BB): The stock price has been trading within the upper Bollinger Band, suggesting an overbought condition.
- Volatility: The volatility has been relatively stable, with the Bollinger Bands width remaining consistent.
Volume Analysis:
- On-Balance Volume (OBV): The OBV indicator has shown a positive trend, indicating accumulation by investors.
- Chaikin Money Flow (CMF): The CMF has been increasing, suggesting strong buying pressure in the stock.
Key Observations:
- The stock is currently in an upward trend based on moving averages and MACD.
- Momentum indicators suggest a potential reversal due to overbought conditions.
- Volatility remains stable with the stock trading near the upper Bollinger Band.
- Volume indicators show positive accumulation and strong buying pressure.
Conclusion:
Based on the analysis of technical indicators, the next few days for DOL stock are likely to see a consolidation or minor pullback as momentum indicators signal overbought conditions. However, the overall trend remains bullish supported by moving averages and positive volume indicators. Traders may consider taking profits or waiting for a better entry point during a potential pullback. Long-term investors can hold their positions with a bullish bias given the positive trend and volume accumulation.