Technical Analysis of DOGG 2024-05-10
Overview:
In analyzing the technical indicators for DOGG stock over the last 5 days, we will delve into the trend, momentum, volatility, and volume indicators to provide a comprehensive outlook on the possible stock price movement in the coming days. By examining these key indicators, we aim to offer valuable insights and recommendations for potential investors.
Trend Analysis:
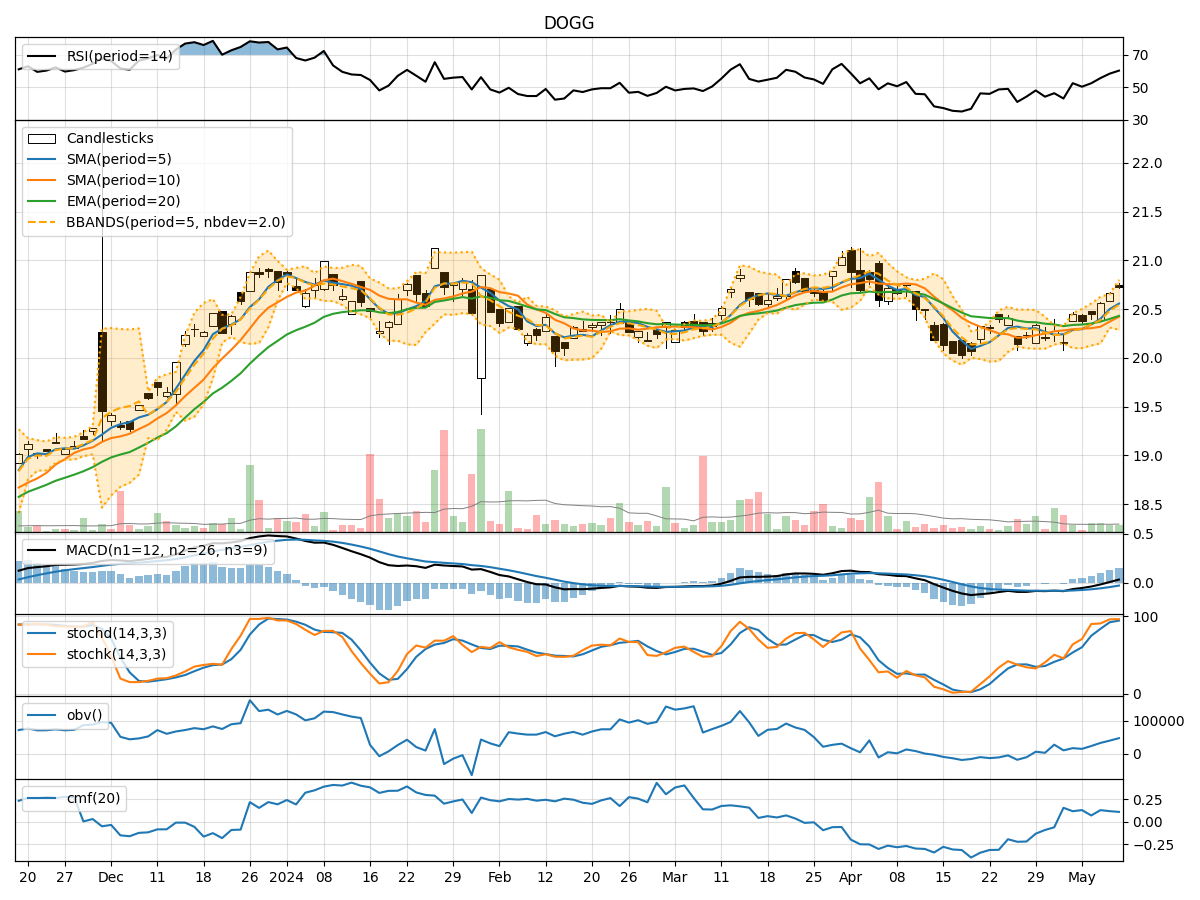
- Moving Averages (MA): The 5-day Moving Average (MA) has been consistently above the Simple Moving Average (SMA) and Exponential Moving Average (EMA), indicating a bullish trend.
- MACD: The MACD line has been consistently above the signal line, with both lines showing an upward trend, suggesting bullish momentum.
- RSI: The Relative Strength Index (RSI) has been gradually increasing and is currently in the neutral zone, indicating potential for further upside.
Momentum Analysis:
- Stochastic Oscillator: Both %K and %D lines of the Stochastic Oscillator are in the overbought territory, suggesting a potential reversal or consolidation.
- Williams %R: The Williams %R is in the oversold region, indicating a possible buying opportunity.
Volatility Analysis:
- Bollinger Bands (BB): The stock price has been trading within the upper Bollinger Band, indicating an overbought condition.
- Bollinger Band Width (BBW): The Bollinger Band Width has been relatively stable, suggesting a period of consolidation.
Volume Analysis:
- On-Balance Volume (OBV): The OBV has been declining, indicating selling pressure in the stock.
- Chaikin Money Flow (CMF): The CMF has been positive but decreasing, signaling a potential decrease in buying pressure.
Conclusion:
Based on the analysis of the technical indicators, the stock is currently in an overbought state with signs of potential reversal in momentum. The volatility is relatively stable, indicating a period of consolidation. The volume indicators suggest a bearish bias with selling pressure.
Recommendation:
Considering the overbought conditions and potential reversal signals in momentum indicators, it is advisable to exercise caution. Investors may consider taking profits or waiting for a pullback before entering new positions. Monitoring the price action closely for signs of a reversal or consolidation would be prudent.
Disclaimer:
Remember that technical analysis is not a guaranteed predictor of future price movements, and other fundamental factors can influence stock prices. It is essential to conduct thorough research and consider multiple indicators before making investment decisions. Consulting with a financial advisor is recommended for personalized investment advice.