Technical Analysis of DMBS 2024-05-10
Overview:
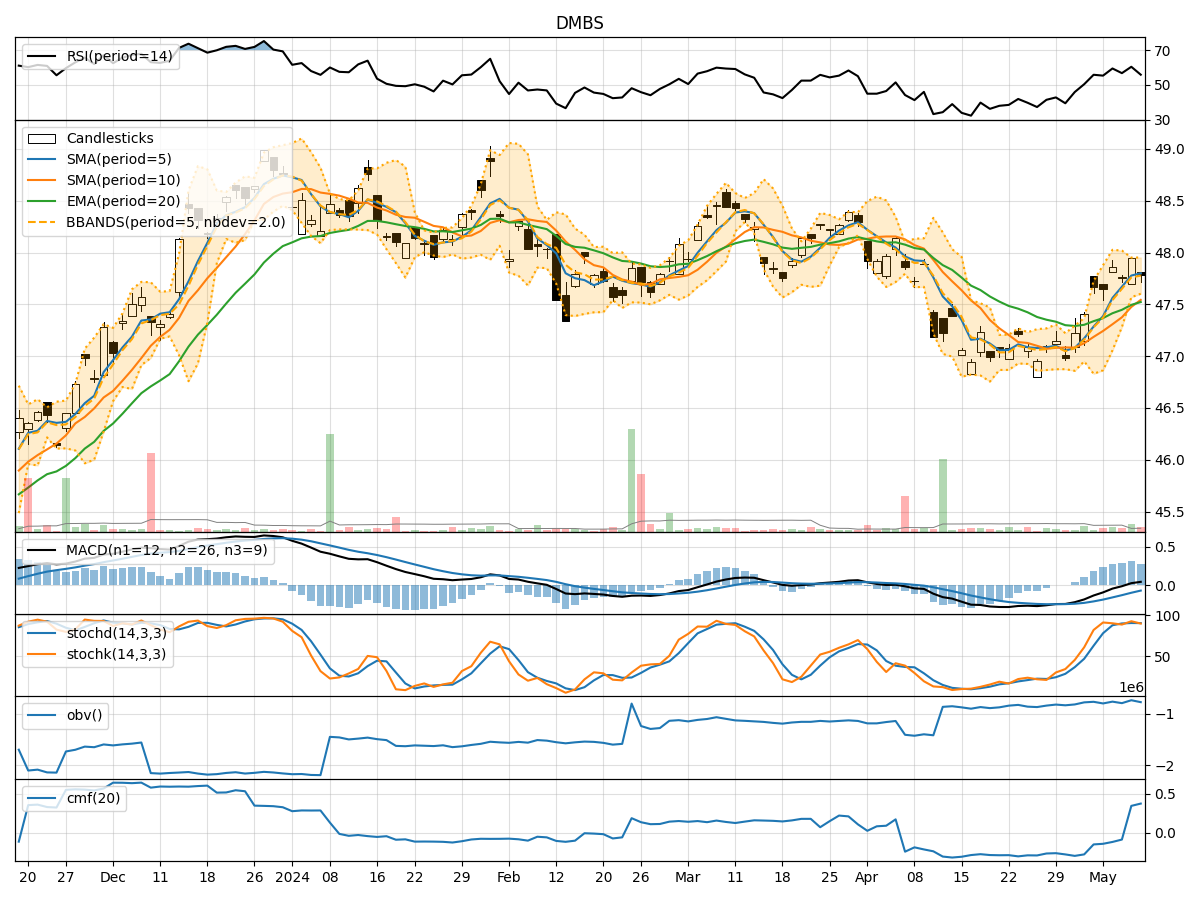
In analyzing the technical indicators for DMBS stock over the last 5 days, we will delve into the trend, momentum, volatility, and volume indicators to provide a comprehensive outlook on the possible stock price movement in the coming days. By examining these key indicators, we aim to offer valuable insights and recommendations for potential investors.
Trend Analysis:
- Moving Averages (MA): The 5-day Moving Average (MA) has been consistently above the Simple Moving Average (SMA) and Exponential Moving Average (EMA), indicating a short-term uptrend.
- MACD: The MACD line has been consistently above the signal line, suggesting bullish momentum in the stock price.
- MACD Histogram: The MACD Histogram has been mostly positive, indicating increasing bullish momentum.
Momentum Analysis:
- RSI: The Relative Strength Index (RSI) has been fluctuating around the 50 level, indicating a neutral momentum in the stock.
- Stochastic Oscillator: Both %K and %D lines of the Stochastic Oscillator have been hovering in the overbought territory, suggesting a potential reversal or consolidation.
- Williams %R: The Williams %R indicator has been mostly negative, indicating a bearish sentiment in the stock.
Volatility Analysis:
- Bollinger Bands: The stock price has mostly stayed within the Bollinger Bands, with the bands narrowing, indicating decreasing volatility.
- Bollinger %B: The %B indicator has been fluctuating around the midline, suggesting a lack of clear direction in price movement.
Volume Analysis:
- On-Balance Volume (OBV): The OBV indicator has shown mixed signals, with no clear trend in volume accumulation or distribution.
- Chaikin Money Flow (CMF): The CMF indicator has been mostly negative, indicating selling pressure in the stock.
Conclusion:
Based on the analysis of the technical indicators, the stock is currently exhibiting mixed signals across different categories. The trend indicators suggest a short-term uptrend, supported by the MACD and moving averages. However, the momentum indicators show signs of potential reversal or consolidation, especially with the Stochastic Oscillator in the overbought zone.
The volatility indicators point towards decreasing volatility, which could lead to a period of consolidation or sideways movement. The volume indicators also indicate mixed signals, with no clear trend in volume accumulation.
Overall Assessment:
- Short-Term Outlook: The stock may experience some consolidation or a minor pullback in the coming days.
- Key Recommendation: Exercise caution and closely monitor the price action for potential entry or exit points. Consider waiting for more clarity in the indicators before making significant trading decisions.
Conclusion:
Based on the current technical analysis, the stock is likely to experience sideways movement or consolidation in the near term. It is advisable to wait for clearer signals before taking any significant trading positions.