Technical Analysis of DMAY 2024-05-10
Overview:
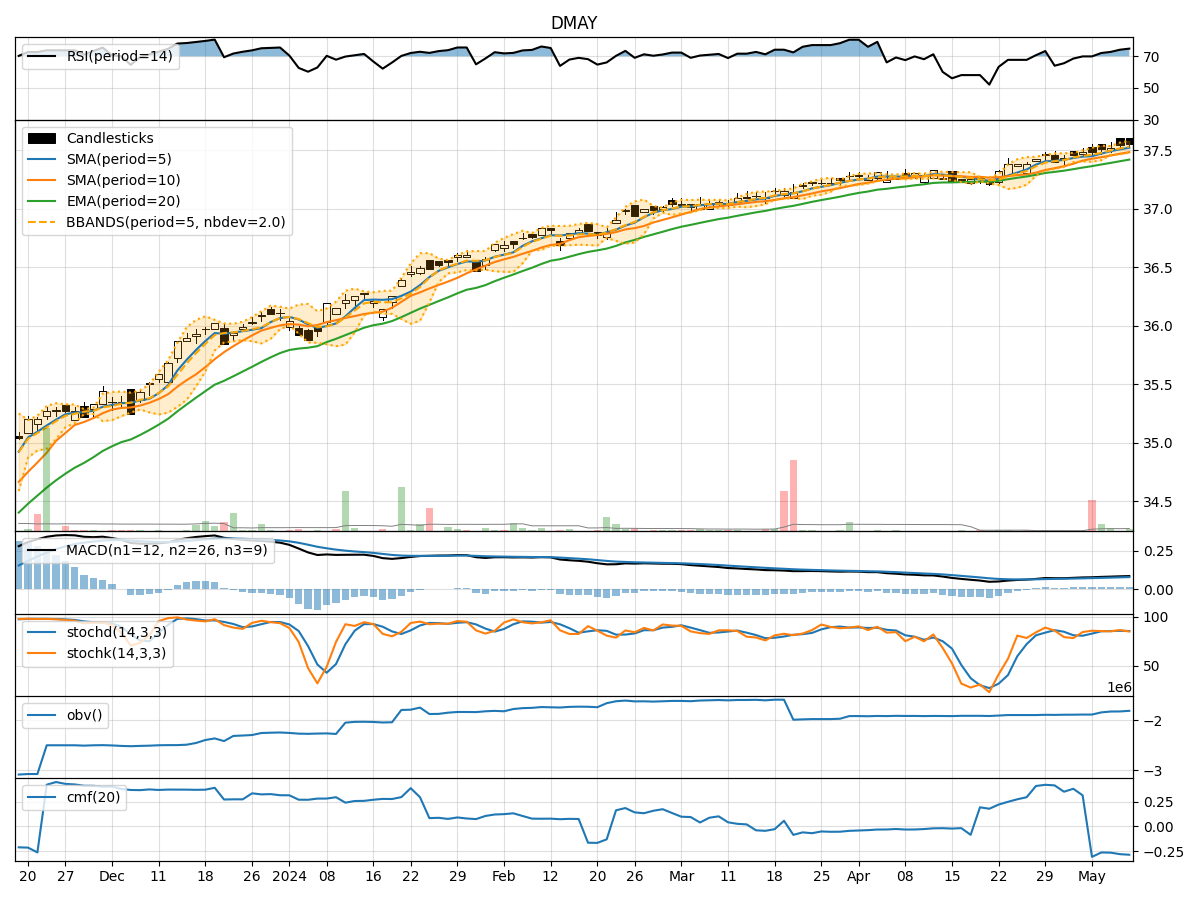
In the last 5 trading days, the stock has shown a consistent uptrend in terms of closing prices. Various technical indicators such as Moving Averages, MACD, RSI, and Stochastic Oscillators suggest a bullish sentiment. However, there are signs of overbought conditions and potential consolidation in the near future. Volatility indicators indicate a narrowing of the Bollinger Bands, which could signal a period of reduced price fluctuations. Volume indicators show a decrease in On-Balance Volume (OBV) and Chaikin Money Flow (CMF), indicating a potential decrease in buying pressure.
Trend Indicators:
- Moving Averages (MA): The stock price has been consistently above the 5-day Moving Average, indicating a short-term uptrend.
- MACD: The MACD line has been above the signal line, suggesting bullish momentum.
- EMA: The Exponential Moving Average has been trending upwards, supporting the bullish sentiment.
Key Observation: The trend indicators point towards a continuation of the upward momentum in the stock price.
Momentum Indicators:
- RSI: The Relative Strength Index is in the overbought territory, indicating a potential reversal or consolidation.
- Stochastic Oscillators: Both %K and %D lines are in the overbought zone, signaling a possible pullback.
- Williams %R: The Williams %R is also in the oversold region, suggesting a potential reversal.
Key Observation: Momentum indicators suggest that the stock may experience a short-term correction or consolidation.
Volatility Indicators:
- Bollinger Bands (BB): The Bollinger Bands are narrowing, indicating decreasing volatility and a potential period of consolidation.
Key Observation: Volatility indicators suggest a possible decrease in price fluctuations and a period of sideways movement.
Volume Indicators:
- On-Balance Volume (OBV): The OBV has been decreasing, indicating a potential decrease in buying pressure.
- Chaikin Money Flow (CMF): The CMF is also declining, suggesting weakening buying momentum.
Key Observation: Volume indicators point towards a potential decrease in buying interest and a possible shift in market sentiment.
Conclusion:
Based on the analysis of the technical indicators, the stock is likely to experience a short-term correction or consolidation in the next few days. The overbought conditions in momentum indicators, coupled with decreasing buying pressure and narrowing volatility, suggest a potential pause in the current uptrend. Traders may consider taking profits or waiting for a better entry point before considering new long positions. It is essential to monitor the price action closely for any signs of a reversal or continuation of the uptrend in the longer term.