Technical Analysis of DJIA 2024-05-10
Overview:
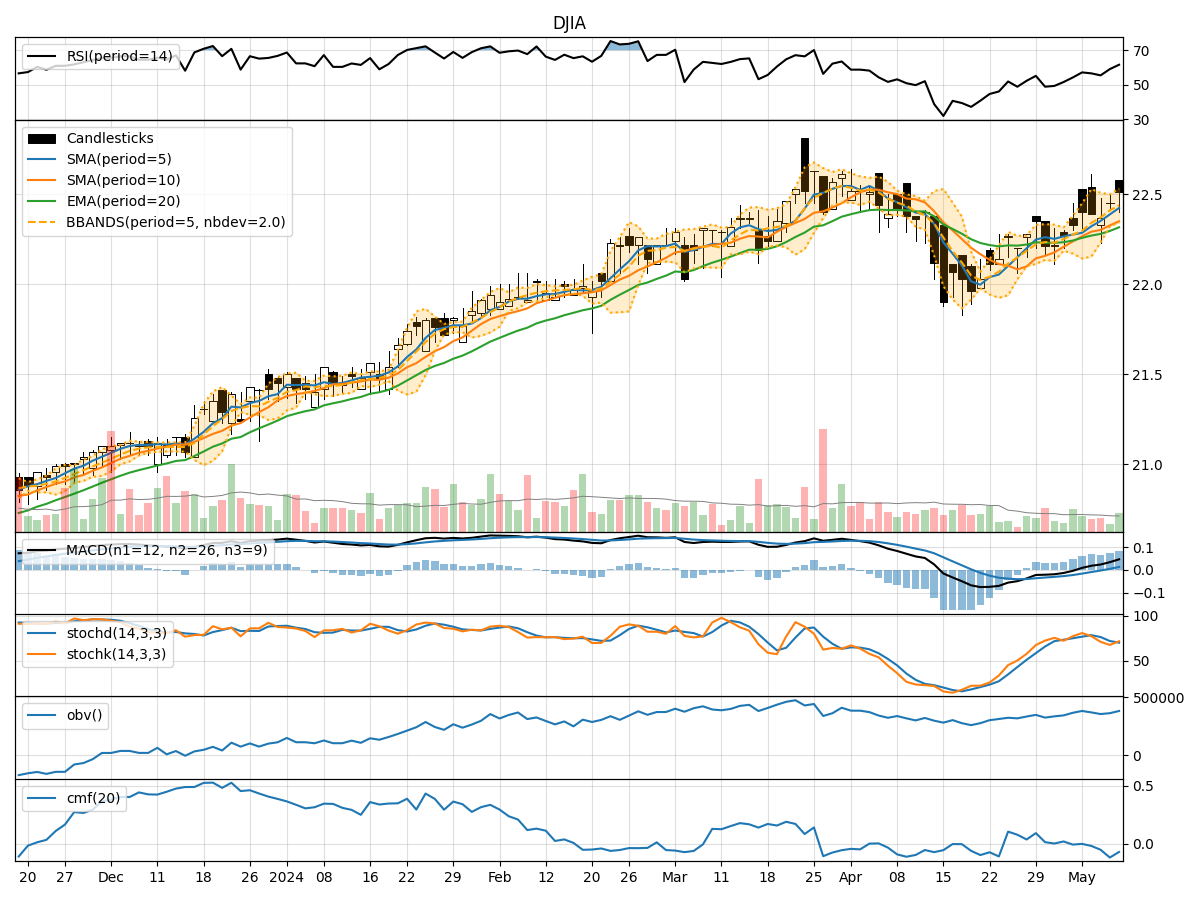
In the last 5 trading days, the DJIA stock has shown mixed signals across various technical indicators. The trend indicators suggest a slightly bullish sentiment with the moving averages trending upwards. Momentum indicators show a neutral to slightly bullish stance, while volatility indicators indicate a narrowing of the Bollinger Bands. Volume indicators reflect a decrease in On-Balance Volume (OBV) and Chaikin Money Flow (CMF), signaling potential selling pressure.
Trend Analysis:
- Moving Averages (MA): The 5-day MA is above the 10-day SMA, indicating a short-term bullish trend.
- MACD: The MACD line is above the signal line, suggesting bullish momentum.
- MACD Histogram: The histogram is positive, indicating increasing bullish momentum.
Momentum Analysis:
- RSI: The RSI is above 50, indicating bullish momentum.
- Stochastic Oscillator: Both %K and %D are in the overbought zone, suggesting a potential reversal.
- Williams %R: The indicator is in the oversold region, indicating a potential buying opportunity.
Volatility Analysis:
- Bollinger Bands (BB): The bands are narrowing, suggesting decreasing volatility.
- BB %B: The %B is above 0.5, indicating a potential bullish signal.
Volume Analysis:
- On-Balance Volume (OBV): The OBV is decreasing, signaling potential distribution.
- Chaikin Money Flow (CMF): The CMF is negative, indicating selling pressure.
Key Observations:
- Trend: The trend is slightly bullish based on moving averages and MACD.
- Momentum: Momentum indicators show mixed signals, with RSI indicating bullish momentum but Stochastic Oscillator suggesting a potential reversal.
- Volatility: Volatility is decreasing, as seen in the narrowing Bollinger Bands.
- Volume: Volume indicators reflect selling pressure with decreasing OBV and negative CMF.
Conclusion:
Based on the analysis of the technical indicators, the next few days' possible stock price movement for DJIA is likely to be sideways to slightly bullish. The trend indicators support a bullish sentiment, while momentum indicators show mixed signals. Volatility is decreasing, indicating a potential consolidation phase, and volume indicators suggest selling pressure. Traders should closely monitor key levels and wait for confirmation before making trading decisions.