Technical Analysis of DJAN 2024-05-10
Overview:
In analyzing the technical indicators for DJAN stock over the last 5 days, we will delve into the trend, momentum, volatility, and volume indicators to provide a comprehensive outlook on the possible stock price movement in the coming days. By examining these key indicators, we aim to offer valuable insights and predictions to guide investment decisions.
Trend Analysis:
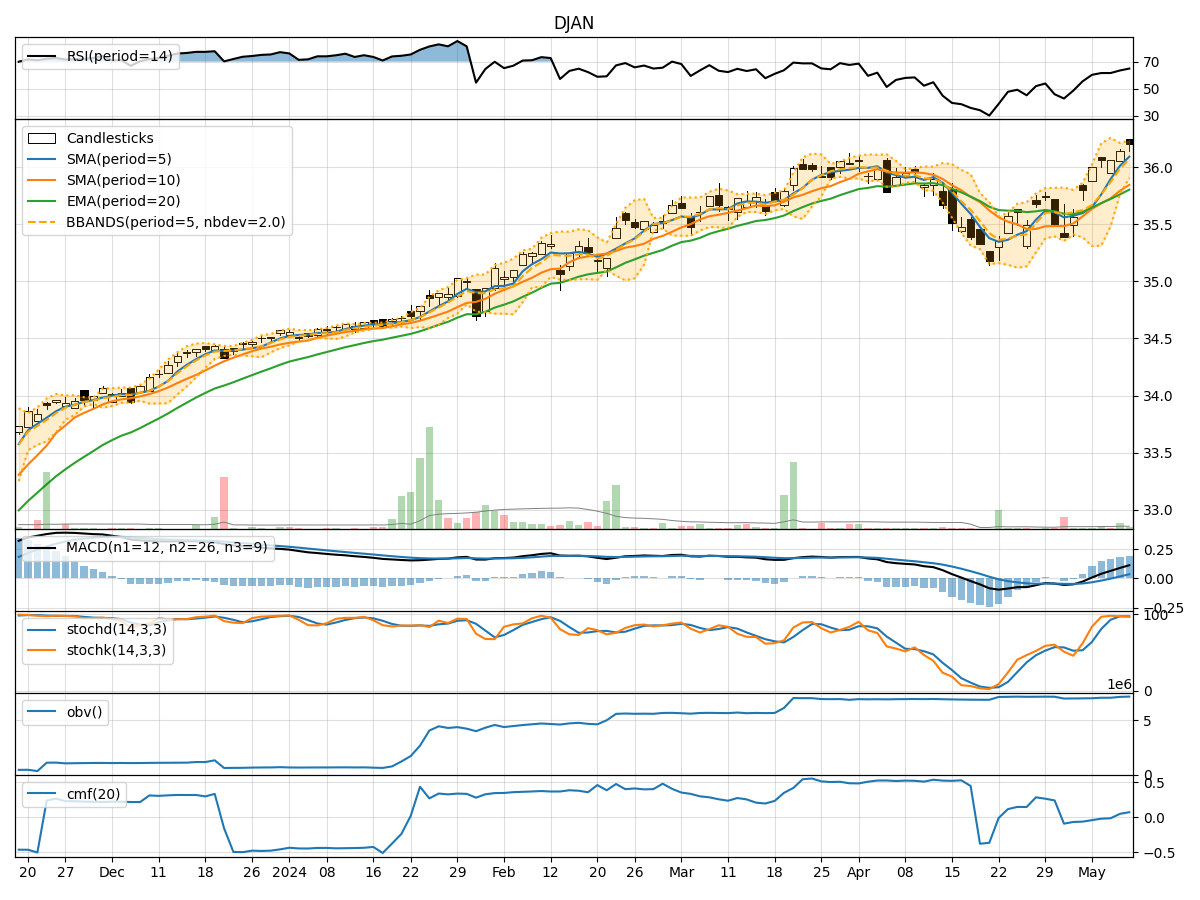
- Moving Averages (MA): The 5-day Moving Average (MA) has been consistently above the Simple Moving Average (SMA) and Exponential Moving Average (EMA), indicating a bullish trend.
- MACD: The MACD line has been consistently above the signal line, with the MACD histogram showing an increasing positive trend, suggesting bullish momentum.
Momentum Analysis:
- RSI: The Relative Strength Index (RSI) has been trending upwards, indicating increasing buying pressure and potential overbought conditions.
- Stochastic Oscillator: Both %K and %D lines of the Stochastic Oscillator have been in the overbought zone, signaling a potential reversal or consolidation.
Volatility Analysis:
- Bollinger Bands (BB): The stock price has been trading within the Bollinger Bands, with the bands narrowing, suggesting decreasing volatility and a possible breakout soon.
- Bollinger %B: The %B indicator has been fluctuating within the bands, indicating potential price reversals or continuation of the current trend.
Volume Analysis:
- On-Balance Volume (OBV): The OBV indicator has shown mixed signals, with volume not confirming the recent price movements.
- Chaikin Money Flow (CMF): The CMF has been negative, indicating selling pressure and potential bearish sentiment in the market.
Conclusion:
Based on the analysis of the technical indicators, the stock is currently in an upward trend with bullish momentum but showing signs of overbought conditions. The volatility is decreasing, suggesting a possible breakout in the near future. However, the volume indicators are not fully supporting the recent price movements, indicating a potential divergence.
Considering all factors, there is a likelihood of a short-term correction or consolidation in the stock price before potentially resuming its upward trajectory. Traders should exercise caution and consider taking profits or implementing risk management strategies in anticipation of a possible pullback.