Technical Analysis of DGZ 2024-05-10
Overview:
In analyzing the technical indicators for DGZ over the last 5 days, we will delve into the trend, momentum, volatility, and volume indicators to provide a comprehensive assessment of the stock's potential price movement. By examining these key factors, we aim to offer valuable insights and predictions for the next few days.
Trend Analysis:
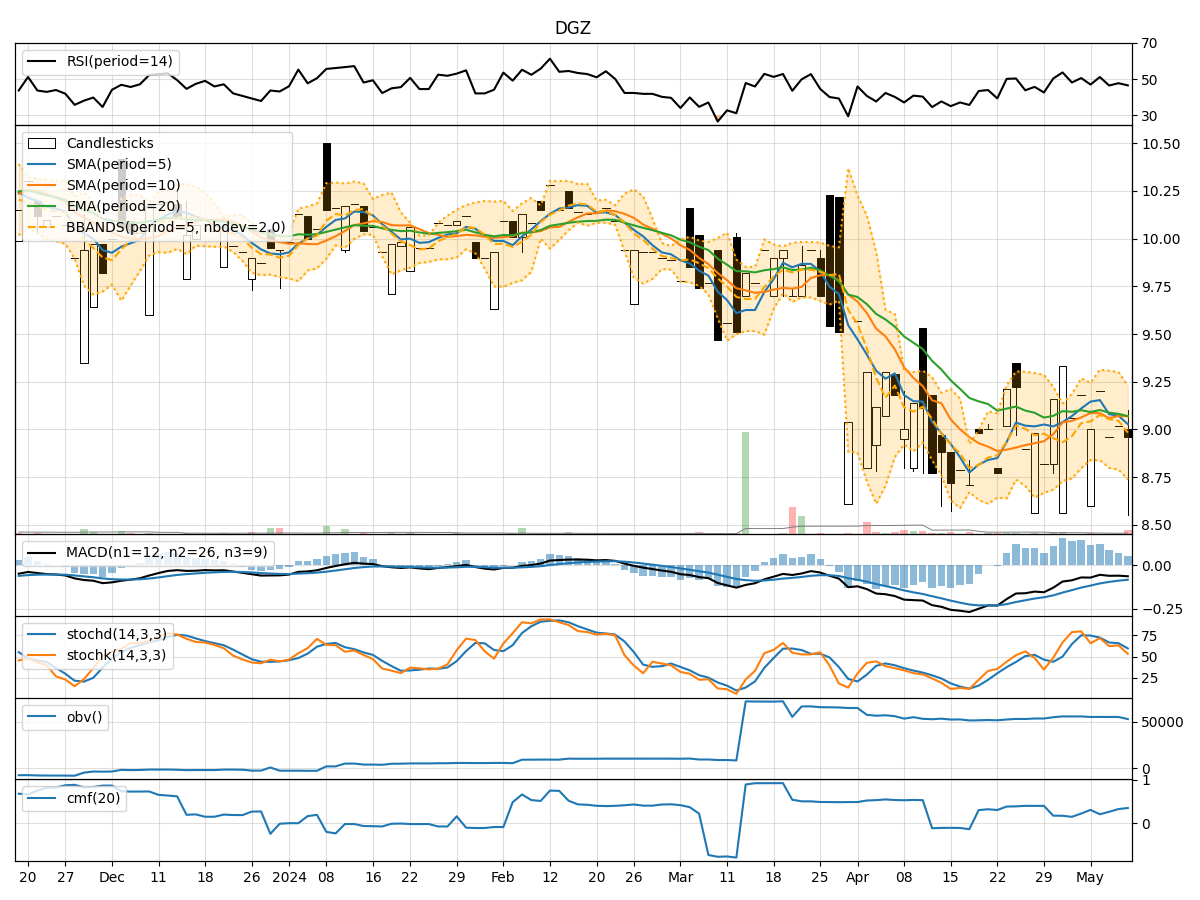
- Moving Averages (MA): The 5-day MA has been fluctuating around the stock price, indicating a lack of clear trend direction.
- MACD: The MACD line has been consistently below the signal line, suggesting a bearish momentum in the short term.
- EMA: The EMA has been relatively stable, reflecting a neutral trend.
Key Observation: The trend indicators show mixed signals with a slight bearish bias.
Momentum Analysis:
- RSI: The RSI has been hovering around the 50 level, indicating a balanced momentum between buying and selling pressure.
- Stochastic Oscillator: Both %K and %D have been fluctuating, reflecting indecision in the market.
- Williams %R: The Williams %R is in oversold territory, suggesting a potential reversal.
Key Observation: Momentum indicators suggest a lack of strong directional momentum.
Volatility Analysis:
- Bollinger Bands: The stock price has been trading within the bands, indicating normal volatility.
- Bollinger %B: The %B indicator is close to 0.5, signifying equilibrium between volatility and price movement.
Key Observation: Volatility indicators suggest a stable price movement with no extreme fluctuations.
Volume Analysis:
- On-Balance Volume (OBV): The OBV has been relatively flat, indicating a balance between buying and selling pressure.
- Chaikin Money Flow (CMF): The CMF is positive, suggesting a net inflow of money into the stock.
Key Observation: Volume indicators show a lack of significant accumulation or distribution.
Conclusion:
Based on the analysis of the technical indicators, the next few days for DGZ are likely to see sideways movement with a slight bearish bias. The lack of clear trend direction, mixed momentum signals, stable volatility, and neutral volume accumulation point towards a period of consolidation. Traders may expect the stock price to remain range-bound with potential downward pressure in the short term. It is advisable to closely monitor key support and resistance levels for potential breakout opportunities.