Technical Analysis of DFNL 2024-05-10
Overview:
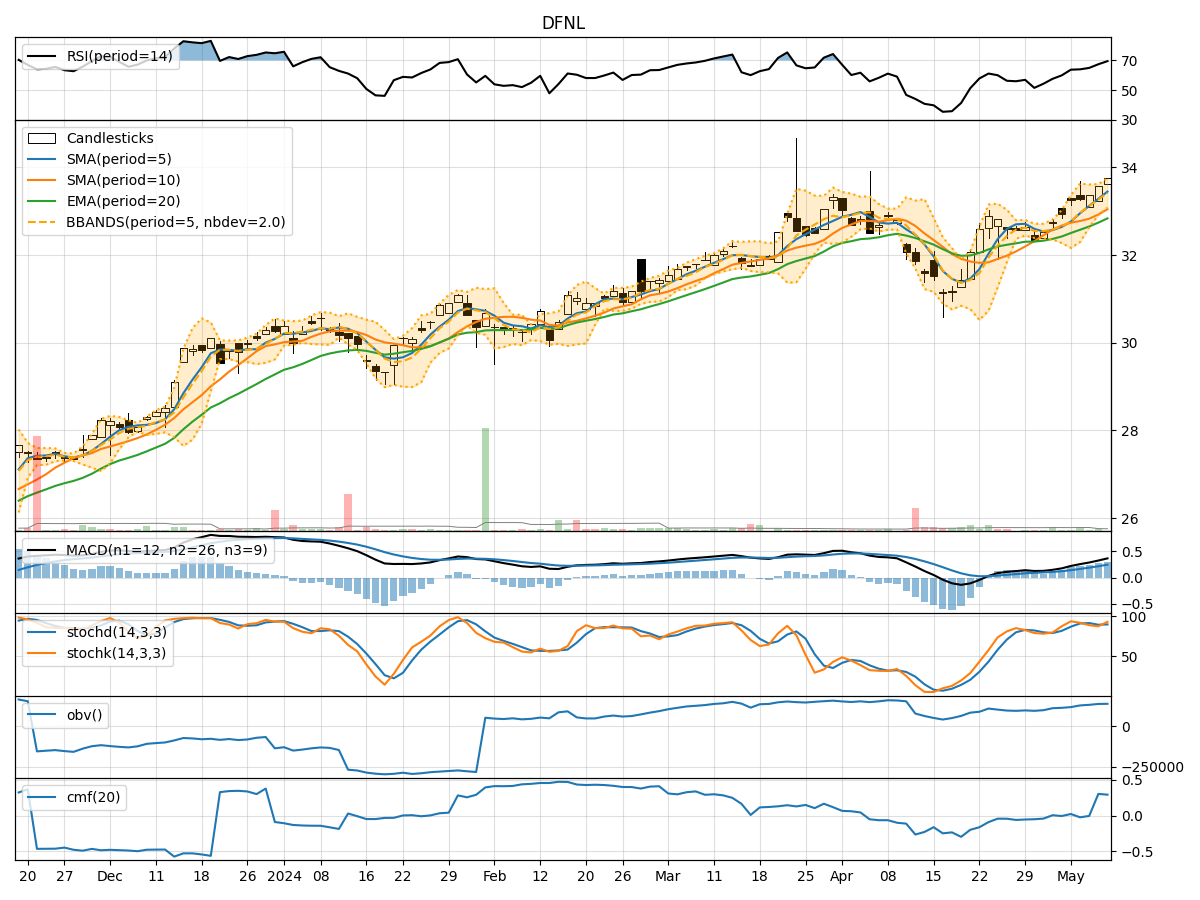
In analyzing the technical indicators for DFNL over the last 5 days, we will delve into the trend, momentum, volatility, and volume indicators to provide a comprehensive assessment of the stock's potential price movement. By examining these key factors, we aim to offer valuable insights and predictions for the upcoming days.
Trend Indicators:
- Moving Averages (MA): The 5-day MA has been consistently above the 10-day SMA, indicating a short-term bullish trend. The EMA(20) has been steadily increasing, reflecting positive momentum.
- MACD: The MACD line has been above the signal line for the past 5 days, suggesting bullish momentum.
- Conclusion: The trend indicators point towards an upward trend in the stock price.
Momentum Indicators:
- RSI: The RSI has been gradually increasing and is currently in the overbought territory, indicating strong buying momentum.
- Stochastic Oscillator: Both %K and %D have been relatively high, suggesting bullish momentum.
- Conclusion: Momentum indicators signal a bullish sentiment in the market.
Volatility Indicators:
- Bollinger Bands (BB): The stock price has been trading within the upper Bollinger Band, indicating increased volatility but also potential overbought conditions.
- Conclusion: Volatility indicators suggest a potential consolidation phase or a slight pullback in the stock price.
Volume Indicators:
- On-Balance Volume (OBV): The OBV has been increasing over the last 5 days, indicating accumulation by investors.
- Chaikin Money Flow (CMF): The CMF(20) has been positive, reflecting buying pressure.
- Conclusion: Volume indicators support the bullish outlook for the stock.
Overall Conclusion:
Based on the analysis of trend, momentum, volatility, and volume indicators, the next few days for DFNL are likely to see continued upward movement in the stock price. The bullish trend supported by strong momentum and positive volume accumulation suggests that investors are optimistic about the stock's potential. However, the increased volatility as indicated by the Bollinger Bands may lead to a temporary pullback or consolidation before the uptrend resumes.
Recommendation:
Considering the overall positive outlook, investors may look for opportunities to enter long positions on pullbacks or consolidation phases to capitalize on the expected upward movement in DFNL. It is essential to monitor the price action closely and set appropriate stop-loss levels to manage risk effectively.
Disclaimer:
Remember that market conditions can change rapidly, and unexpected events may impact stock prices. It is crucial to conduct further research and consider fundamental factors alongside technical analysis before making investment decisions. Consulting with a financial advisor can provide personalized guidance tailored to your investment goals and risk tolerance.