Technical Analysis of DECW 2024-05-10
Overview:
In analyzing the technical indicators for DECW over the last 5 days, we will delve into the trend, momentum, volatility, and volume indicators to provide a comprehensive outlook on the possible stock price movement. By examining these key aspects, we aim to offer valuable insights and predictions for the upcoming trading days.
Trend Indicators:
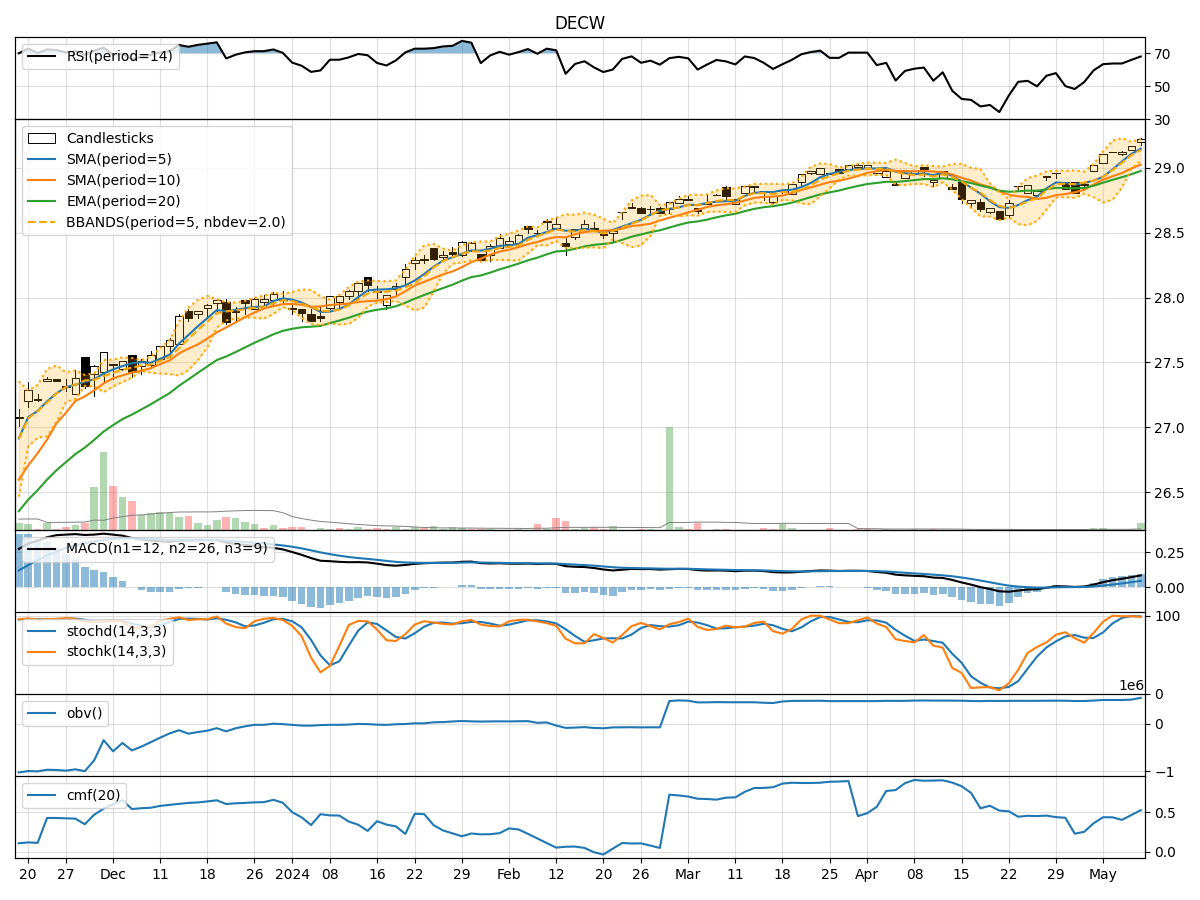
- Moving Averages (MA): The 5-day Moving Average has been consistently above the Simple Moving Average (SMA) and Exponential Moving Average (EMA), indicating a bullish trend.
- MACD: The MACD line has been consistently above the signal line, with both lines showing an upward trend, suggesting bullish momentum.
- MACD Histogram: The MACD Histogram has been increasing over the past 5 days, indicating strengthening bullish momentum.
Momentum Indicators:
- RSI: The Relative Strength Index (RSI) has been gradually increasing and is currently in the overbought territory, signaling a strong bullish momentum.
- Stochastic Oscillator: Both %K and %D lines of the Stochastic Oscillator have been consistently high, indicating strong buying pressure.
- Williams %R: The Williams %R is in the oversold region, suggesting a potential reversal in the short term.
Volatility Indicators:
- Bollinger Bands: The stock price has been trading within the Bollinger Bands, with the bands narrowing, indicating decreasing volatility.
- Bollinger %B: The %B indicator is above 0.5, suggesting a bullish trend.
Volume Indicators:
- On-Balance Volume (OBV): The OBV has been increasing over the last 5 days, indicating strong buying volume.
- Chaikin Money Flow (CMF): The CMF has been positive and increasing, reflecting buying pressure in the market.
Key Observations and Opinions:
- Trend: The trend indicators suggest a strong bullish sentiment in the market.
- Momentum: Momentum indicators indicate a continuation of the bullish momentum, albeit with some signs of potential short-term reversal.
- Volatility: Volatility has been decreasing, which could indicate a period of consolidation or a potential breakout.
- Volume: Increasing OBV and positive CMF signal strong buying interest in the stock.
Conclusion:
Based on the analysis of the technical indicators, the next few days are likely to see continued upward movement in the stock price of DECW. The bullish trend, supported by strong momentum and buying volume, suggests that the stock is poised for further gains. Traders and investors may consider buying opportunities in DECW, with a focus on managing risk in case of any short-term pullbacks.