Technical Analysis of DDM 2024-05-10
Overview:
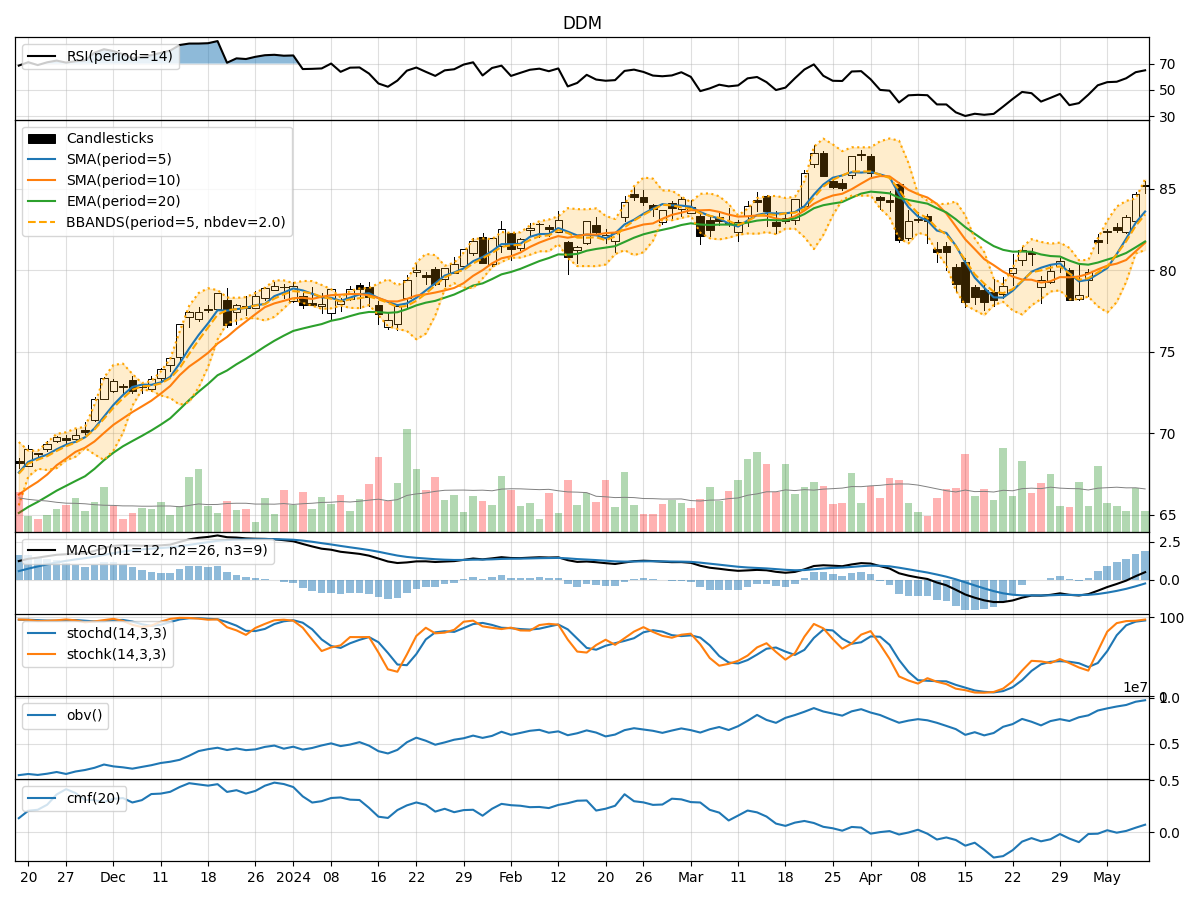
In the last 5 trading days, the stock price has shown a consistent uptrend, supported by increasing volume and positive momentum indicators. The volatility has also been relatively stable, indicating a controlled price movement.
Trend Indicators Analysis:
- Moving Averages (MA): The stock price has been consistently above the 5-day moving average, indicating a short-term uptrend. The Simple Moving Average (SMA) and Exponential Moving Average (EMA) have also been trending upwards, supporting the bullish momentum.
- Moving Average Convergence Divergence (MACD): The MACD line has been consistently above the signal line, indicating a bullish trend. The MACD Histogram has been increasing, showing strengthening bullish momentum.
Momentum Indicators Analysis:
- Relative Strength Index (RSI): The RSI has been in the bullish zone above 50, indicating strength in the current uptrend.
- Stochastic Oscillator: Both %K and %D lines have been in the overbought zone, suggesting a strong bullish momentum.
- Williams %R (Willams %R): The Williams %R has been consistently in the oversold territory, indicating a potential reversal to the upside.
Volatility Indicators Analysis:
- Bollinger Bands (BB): The stock price has been trading within the upper Bollinger Band, suggesting an overbought condition. However, the bands have not shown significant expansion, indicating controlled volatility.
- Bollinger Band %B (BB %B): The %B value has been above 0.5, indicating an uptrend with potential overbought conditions.
Volume Indicators Analysis:
- On-Balance Volume (OBV): The OBV has been steadily increasing, reflecting strong buying pressure and confirming the uptrend.
- Chaikin Money Flow (CMF): The CMF has been positive, indicating that money is flowing into the stock, supporting the bullish bias.
Key Observations:
- The stock is in a strong uptrend, supported by positive trend, momentum, and volume indicators.
- The volatility is relatively stable, suggesting controlled price movements despite the uptrend.
- The buying pressure is evident from the increasing OBV and positive CMF, indicating investor confidence in the stock.
Conclusion:
Based on the analysis of the technical indicators, the next few days are likely to see continued upward movement in the stock price. The strong bullish trend, supported by positive momentum and volume indicators, suggests that the stock is poised for further gains. Traders and investors may consider buying opportunities in line with the prevailing uptrend.