Technical Analysis of DAX 2024-05-10
Overview:
In analyzing the technical indicators for the DAX stock over the last 5 days, we will delve into the trends, momentum, volatility, and volume indicators to provide a comprehensive outlook on the possible stock price movement in the coming days. By examining these key indicators, we aim to offer valuable insights and recommendations for potential investors.
Trend Indicators:
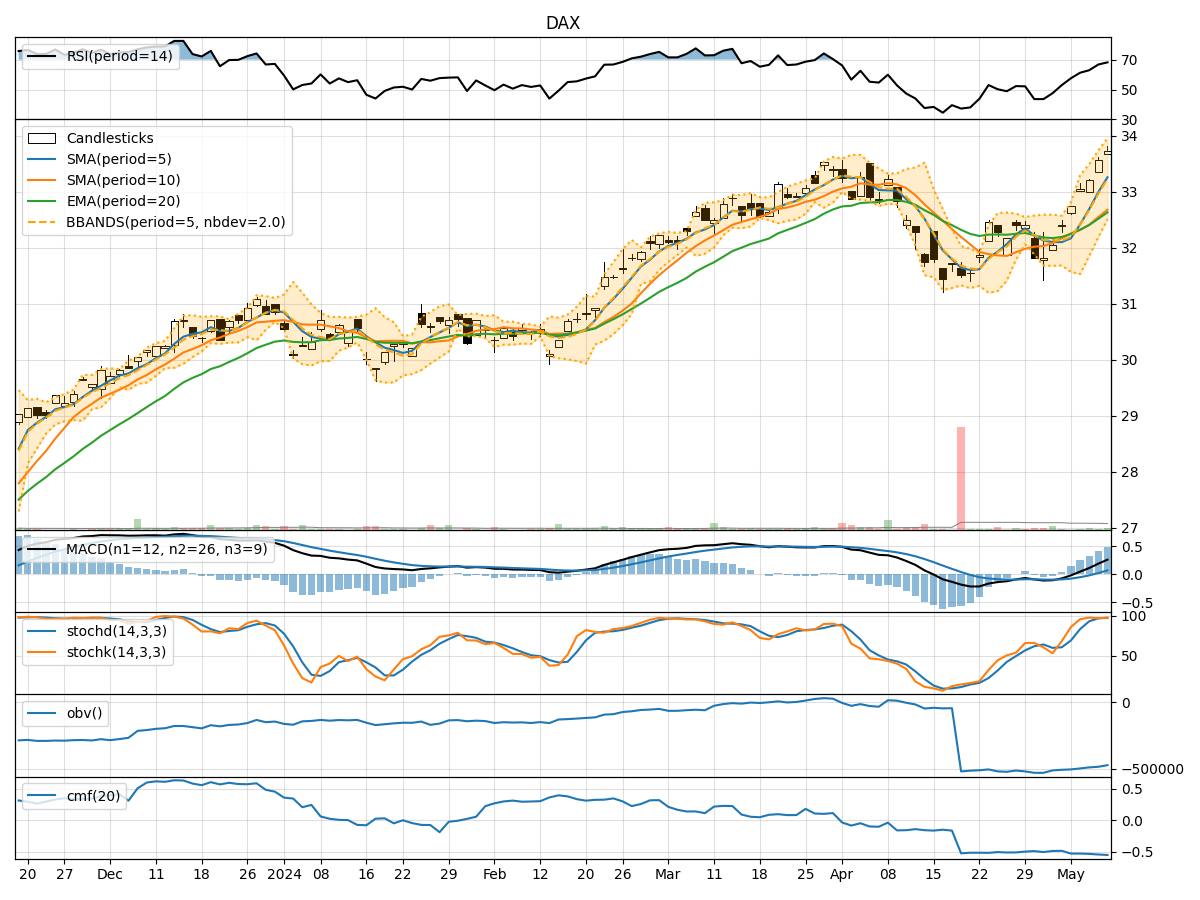
- Moving Averages (MA): The 5-day Moving Average (MA) has been consistently above the Simple Moving Average (SMA) and Exponential Moving Average (EMA), indicating a bullish trend.
- MACD: The Moving Average Convergence Divergence (MACD) has shown positive values, with the MACD line consistently above the Signal line, suggesting a bullish momentum.
- MACD Histogram: The MACD Histogram has been increasing over the past 5 days, indicating strengthening bullish momentum.
Momentum Indicators:
- RSI: The Relative Strength Index (RSI) has been trending upwards and is currently in the overbought territory, suggesting a strong bullish momentum.
- Stochastic Oscillator: Both %K and %D lines of the Stochastic Oscillator are in the overbought zone, indicating a potential reversal or consolidation.
- Williams %R: The Williams %R is also in the overbought region, signaling a possible pullback in the stock price.
Volatility Indicators:
- Bollinger Bands: The Bollinger Bands have been widening, indicating increased volatility in the stock price.
- Bollinger %B: The %B indicator is below 1, suggesting that the stock price is trading below the upper Bollinger Band, potentially indicating a buying opportunity.
- Bollinger Band Width: The Band Width has been expanding, reflecting the heightened volatility in the market.
Volume Indicators:
- On-Balance Volume (OBV): The OBV has been declining over the last 5 days, indicating a potential distribution phase.
- Chaikin Money Flow (CMF): The CMF has been negative, suggesting selling pressure in the stock.
Key Observations and Opinions:
- Trend: The trend indicators point towards a strong bullish sentiment in the stock, supported by the moving averages and MACD.
- Momentum: While momentum indicators like RSI signal a strong bullish momentum, the Stochastic and Williams %R indicators suggest a potential reversal or consolidation in the short term.
- Volatility: The widening Bollinger Bands and increasing Band Width indicate heightened volatility, which could lead to sharp price movements.
- Volume: The declining OBV and negative CMF imply a divergence between price and volume, signaling a potential weakening of the bullish trend.
Conclusion:
Based on the analysis of the technical indicators, the stock is currently in a strong bullish trend with increased volatility. However, the overbought conditions in the momentum indicators and the divergence in volume indicators suggest a potential short-term pullback or consolidation in the stock price. Investors should closely monitor the price action and key support levels for potential entry or exit points.