Technical Analysis of CWB 2024-05-10
Overview:
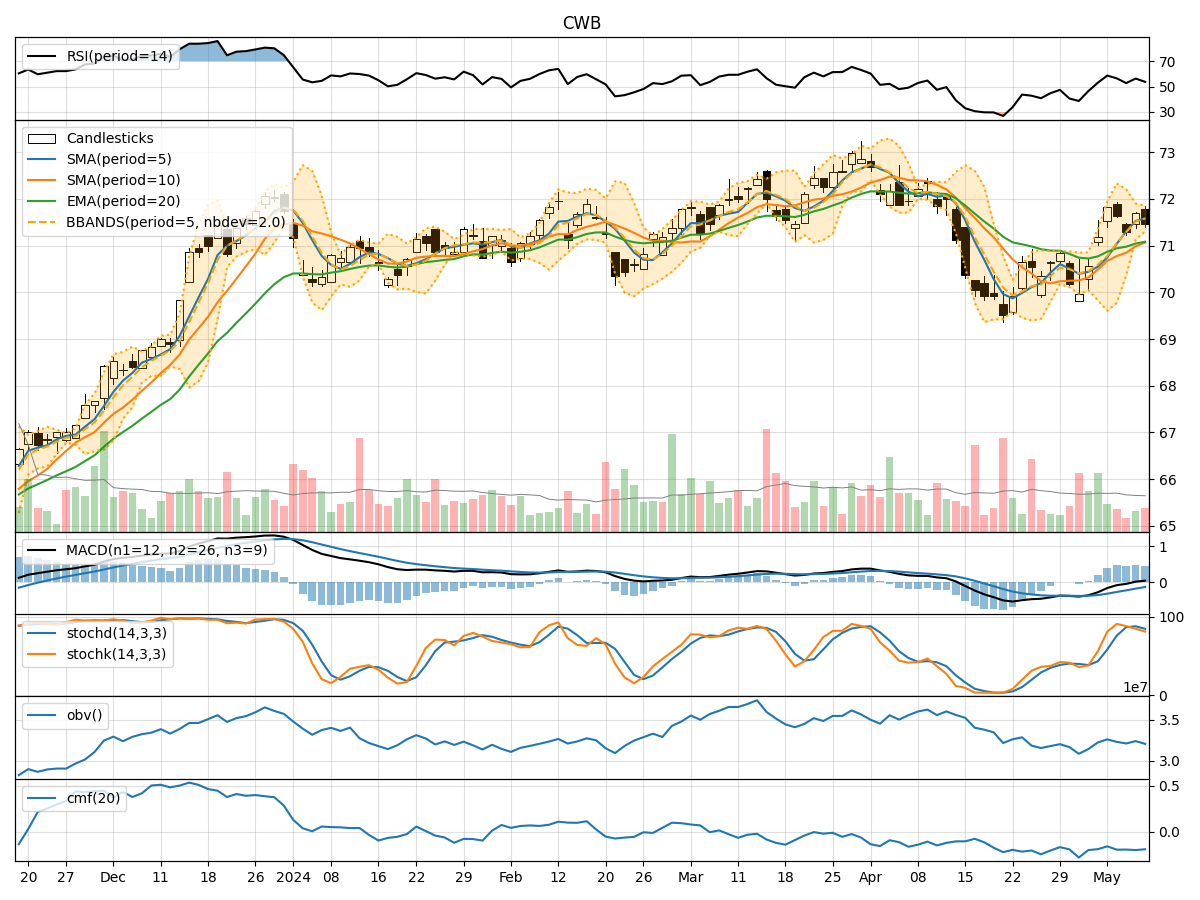
In analyzing the technical indicators for CWB over the last 5 days, we will delve into the trend, momentum, volatility, and volume indicators to provide a comprehensive outlook on the possible stock price movement in the coming days.
Trend Analysis:
- Moving Averages (MA): The 5-day MA has been consistently above the closing prices, indicating a short-term uptrend.
- MACD: The MACD line has been positive, suggesting bullish momentum.
- RSI: The RSI has been fluctuating around the 50 level, indicating a neutral stance.
Momentum Analysis:
- Stochastic Oscillator: The Stochastic indicators have been in overbought territory, signaling a potential reversal.
- Williams %R (Willr): The Willr has been in oversold territory, suggesting a possible bounce back.
Volatility Analysis:
- Bollinger Bands (BB): The stock price has been trading within the Bollinger Bands, indicating a period of consolidation.
- BB% (BB Percentage): The BB% has been fluctuating within a narrow range, reflecting low volatility.
Volume Analysis:
- On-Balance Volume (OBV): The OBV has been fluctuating, indicating indecision among investors.
- Chaikin Money Flow (CMF): The CMF has been negative, suggesting selling pressure.
Key Observations:
- The trend indicators suggest a bullish bias in the short term.
- Momentum indicators show signs of potential reversal from overbought levels.
- Volatility indicators point towards a period of consolidation.
- Volume indicators reflect indecision and selling pressure in the market.
Conclusion:
Based on the analysis of the technical indicators, the next few days' possible stock price movement for CWB is likely to experience a short-term consolidation phase with a potential downward bias. Traders should exercise caution and consider waiting for clearer signals before making significant trading decisions.