Technical Analysis of CVRT 2024-05-10
Overview:
In analyzing the technical indicators for CVRT over the last 5 days, we will delve into the trend, momentum, volatility, and volume indicators to provide a comprehensive assessment of the stock's potential price movement. By examining these key factors, we aim to offer valuable insights and predictions for the next few days.
Trend Analysis:
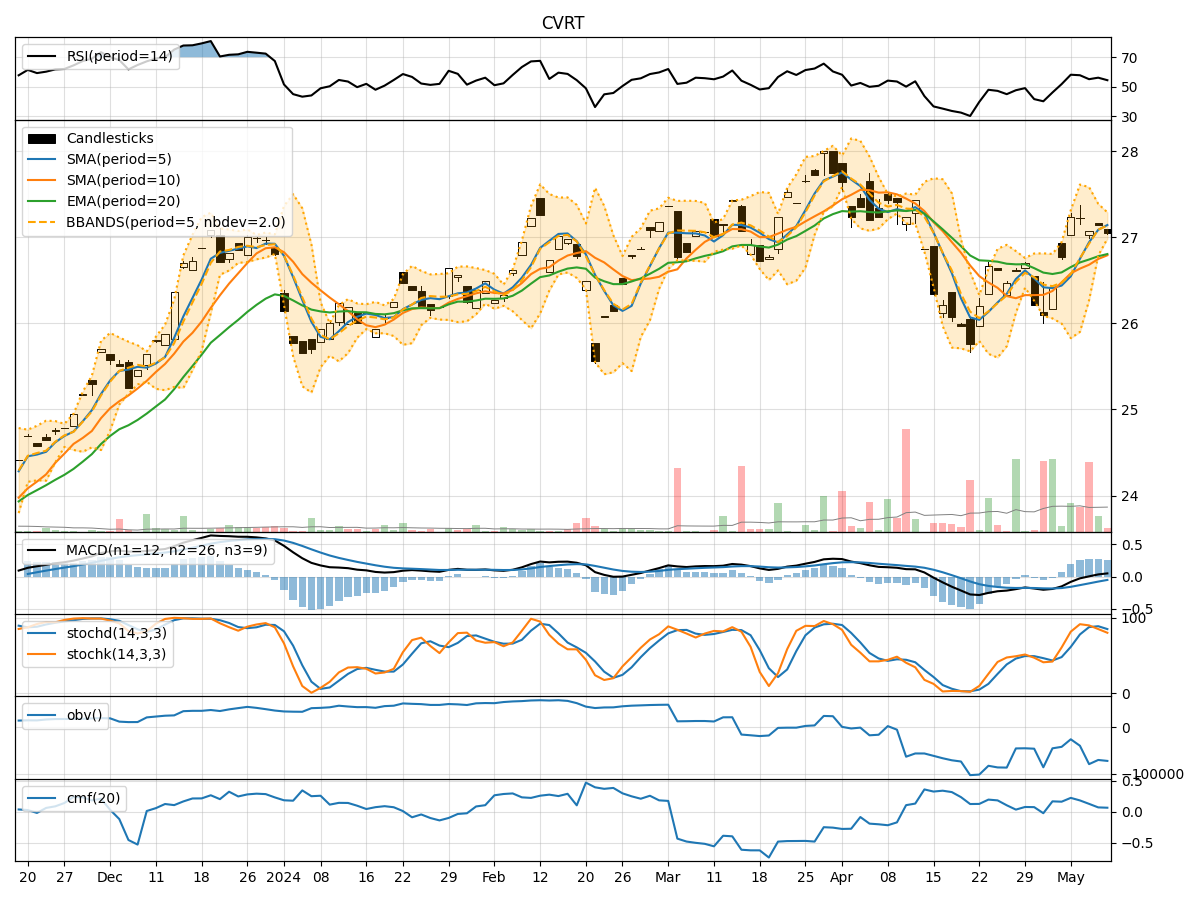
- Moving Averages (MA): The 5-day Moving Average (MA) has been trending above the Simple Moving Average (SMA) and Exponential Moving Average (EMA) over the past 5 days, indicating a bullish trend.
- MACD: The Moving Average Convergence Divergence (MACD) has shown positive values, with the MACD line consistently above the Signal line, suggesting bullish momentum.
Momentum Analysis:
- RSI: The Relative Strength Index (RSI) has been fluctuating around the 50 level, indicating a neutral momentum in the stock.
- Stochastic Oscillator: Both %K and %D lines of the Stochastic Oscillator have been hovering in the overbought territory, signaling a potential reversal or consolidation.
Volatility Analysis:
- Bollinger Bands (BB): The Bollinger Bands have been narrowing, indicating decreasing volatility in the stock price.
Volume Analysis:
- On-Balance Volume (OBV): The OBV has shown a slight decline over the past 5 days, suggesting a decrease in buying pressure.
- Chaikin Money Flow (CMF): The CMF has been positive but decreasing, indicating a potential weakening of buying pressure.
Key Observations:
- The trend indicators suggest a bullish sentiment in the short term.
- Momentum indicators show a neutral stance with a possibility of a reversal.
- Volatility has been decreasing, indicating a potential period of consolidation.
- Volume indicators point towards a slight decrease in buying pressure.
Conclusion:
Based on the analysis of the technical indicators, the next few days for CVRT could see sideways movement with a potential for a slight pullback in the stock price. Traders should exercise caution and monitor key levels closely for any signs of a reversal in the current trend.