Technical Analysis of CONL 2024-05-10
Overview:
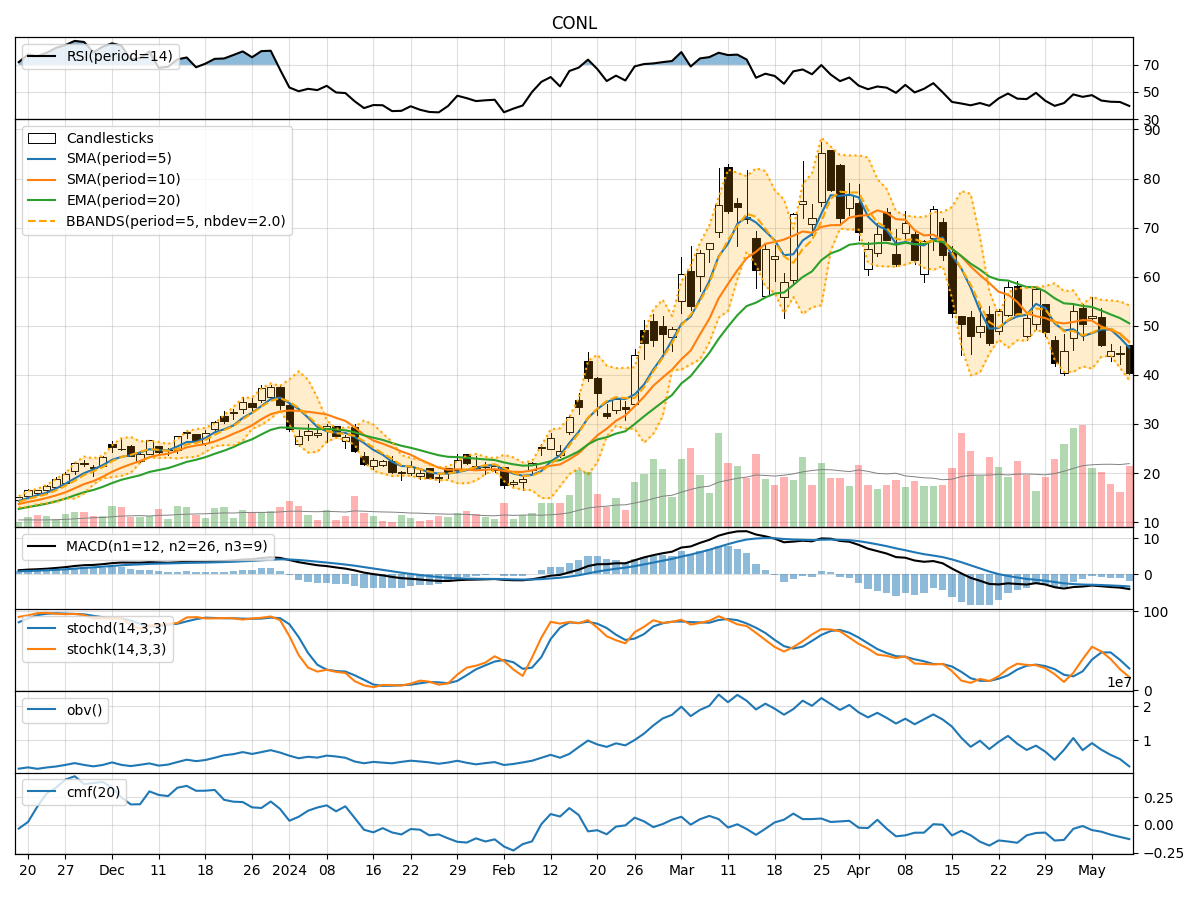
In analyzing the technical indicators for CONL over the last 5 days, we will delve into the trend, momentum, volatility, and volume indicators to provide a comprehensive outlook on the possible stock price movement in the coming days. By examining these key aspects, we aim to offer valuable insights and predictions to guide your investment decisions.
Trend Analysis:
- Moving Averages (MA): The 5-day Moving Average (MA) has been consistently decreasing, indicating a downward trend in the stock price.
- MACD: The Moving Average Convergence Divergence (MACD) is also in negative territory, with the MACD line below the signal line, suggesting bearish momentum.
- EMA: The Exponential Moving Average (EMA) is trending downwards, further supporting the bearish sentiment in the short to medium term.
Momentum Analysis:
- RSI: The Relative Strength Index (RSI) has been declining and is currently below 50, indicating weakening momentum and potential oversold conditions.
- Stochastic Oscillator: Both %K and %D lines of the Stochastic Oscillator are in the oversold region, signaling a potential reversal or bounce in the stock price.
- Williams %R: The Williams %R is extremely oversold, suggesting a possible short-term bounce or reversal.
Volatility Analysis:
- Bollinger Bands: The Bollinger Bands are narrowing, indicating decreasing volatility in the stock price.
- Bollinger %B: The %B indicator is below 0.2, suggesting that the stock is oversold and may see a potential reversal or bounce in the near term.
Volume Analysis:
- On-Balance Volume (OBV): The OBV has been declining, indicating selling pressure and a bearish sentiment among investors.
- Chaikin Money Flow (CMF): The CMF is negative, reflecting outflow of money from the stock and a bearish outlook.
Conclusion:
Based on the analysis of the technical indicators, the stock of CONL is currently in a strong bearish phase. The trend indicators, momentum oscillators, volatility measures, and volume indicators all point towards a continued downward movement in the stock price in the near future. Investors should exercise caution and consider waiting for signs of a reversal or stabilization before considering any long positions. Downward price movement is highly likely in the next few days.
It is crucial to monitor the indicators closely for any signs of a potential trend reversal or shift in market sentiment. Short-selling or staying on the sidelines until a clearer picture emerges might be prudent strategies in the current market conditions. Remember, always conduct thorough research and consider multiple factors before making any investment decisions.