Technical Analysis of CIZ 2024-05-10
Overview:
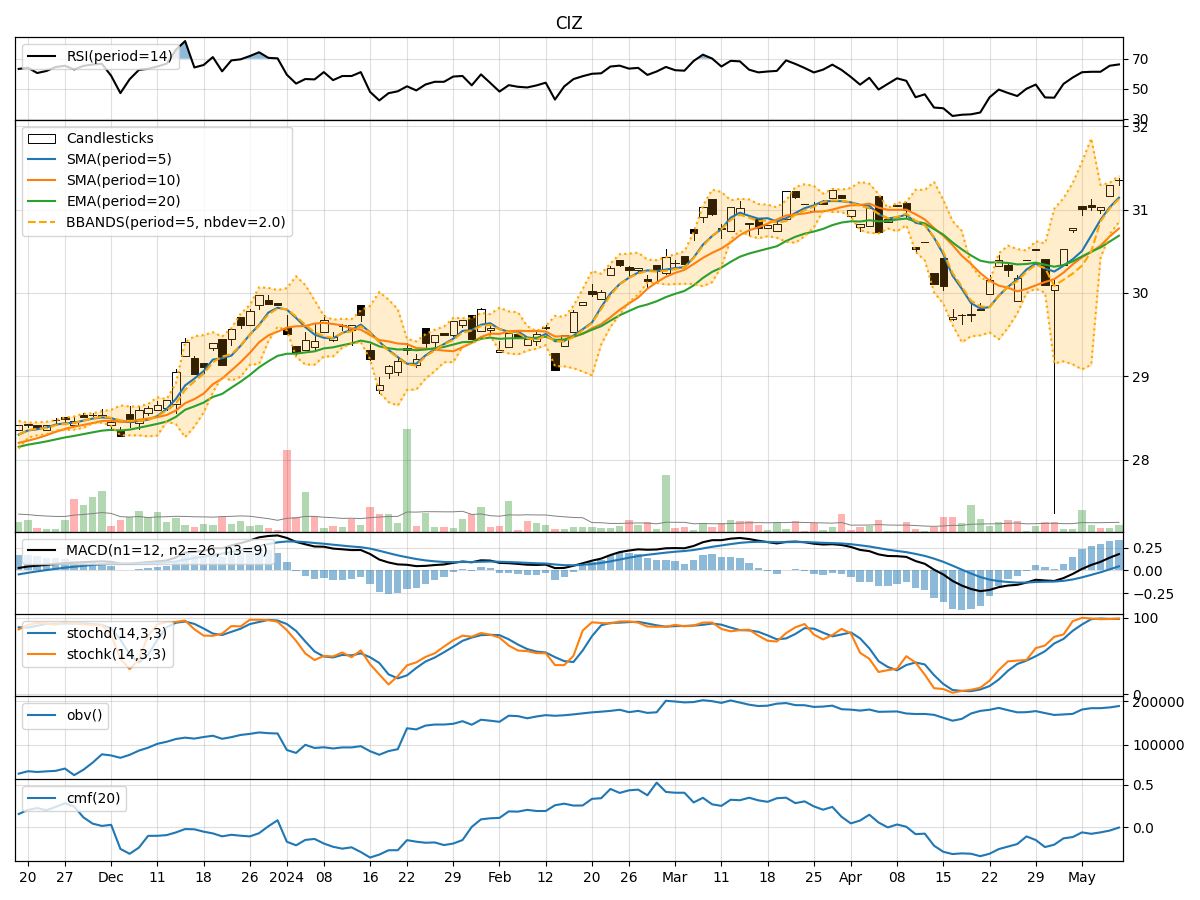
In analyzing the technical indicators for CIZ stock over the last 5 days, we will delve into the trends, momentum, volatility, and volume aspects to provide a comprehensive outlook on the possible stock price movement in the coming days. By examining key indicators such as moving averages, MACD, RSI, Bollinger Bands, and OBV, we aim to offer valuable insights and predictions for informed decision-making.
Trend Analysis:
- Moving Averages (MA): The 5-day MA has been consistently above the closing prices, indicating an upward trend. This suggests a positive momentum in the short term.
- MACD: The MACD line has been above the signal line for the past 5 days, with both lines showing an upward trajectory. This signals a bullish trend in the stock price.
- EMA: The EMA(20) has been steadily increasing, further supporting the bullish sentiment in the stock.
Momentum Analysis:
- RSI: The RSI has been in the range of 60-70, indicating positive momentum in the stock. It is not in overbought territory, suggesting room for further upside.
- Stochastic Oscillator: Both %K and %D lines of the Stochastic Oscillator are in the overbought zone, suggesting a strong bullish momentum.
- Williams %R: The Williams %R is in the oversold region, indicating a potential buying opportunity.
Volatility Analysis:
- Bollinger Bands: The stock price has been trading within the Bollinger Bands, with the bands narrowing in the last few days. This indicates a period of consolidation and lower volatility.
- Bollinger %B: The %B indicator is hovering around 0.8, suggesting that the stock is trading near the upper band. This could imply a short-term pullback.
Volume Analysis:
- On-Balance Volume (OBV): The OBV has been relatively flat, indicating neutral volume flow in the stock.
- Chaikin Money Flow (CMF): The CMF is negative, suggesting outflow of money from the stock in the short term.
Conclusion:
Based on the analysis of the technical indicators, the stock of CIZ is currently exhibiting bullish tendencies in terms of trend and momentum. However, the volatility is indicating a consolidation phase with lower volatility expected in the near future. The volume indicators suggest a neutral stance with no significant inflow or outflow of money.
Forecast:
Considering the overall analysis, the next few days for CIZ stock are likely to see a continuation of the bullish trend supported by positive momentum indicators. However, the stock may experience a short-term pullback due to the narrowing Bollinger Bands and the negative CMF. Traders should watch for potential buying opportunities when the stock price dips. It is advisable to closely monitor the price action and key support levels for any signs of reversal or continuation of the current trend.