Technical Analysis of CHGX 2024-05-10
Overview:
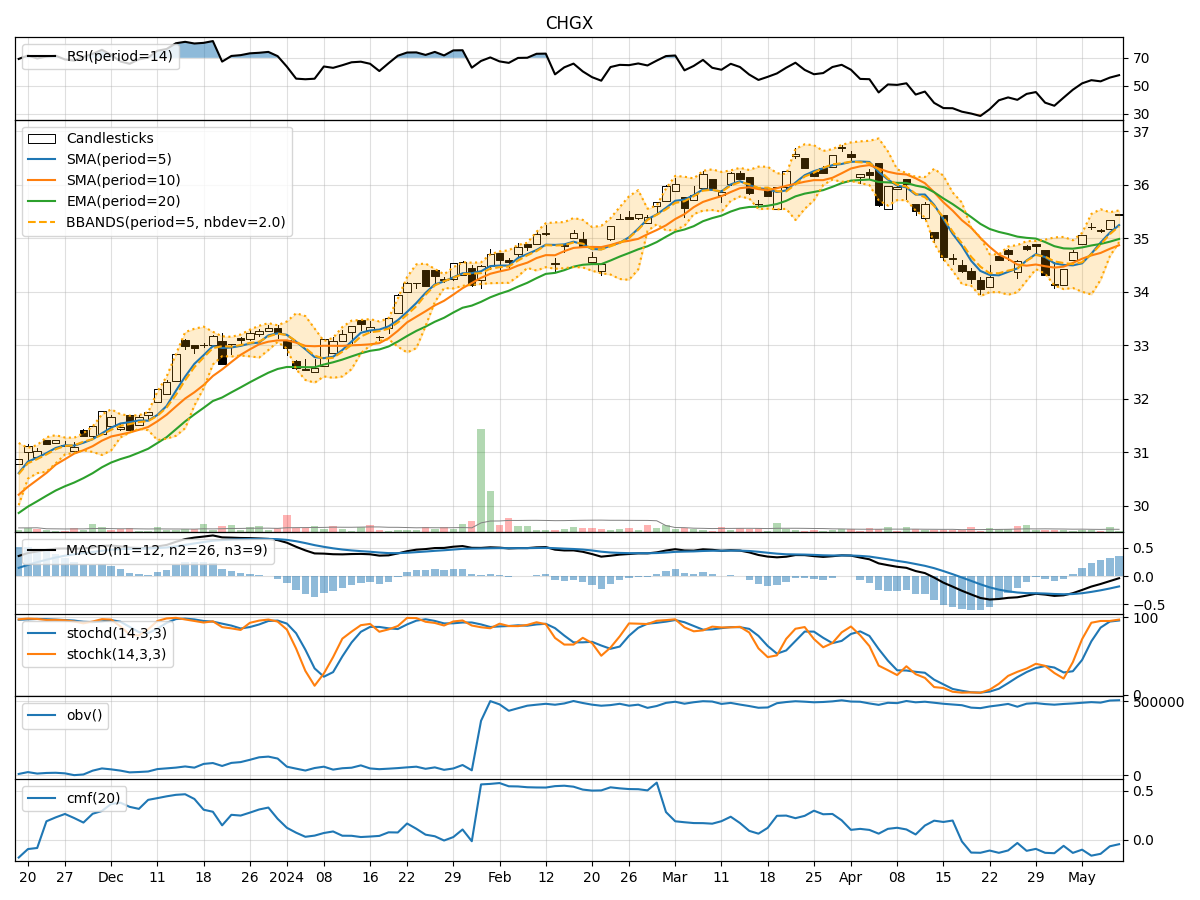
In the last 5 trading days, CHGX stock has shown mixed signals across various technical indicators. The trend indicators suggest a slightly bullish sentiment, with moving averages trending upwards. Momentum indicators indicate a strengthening momentum, while volatility indicators show a decreasing volatility trend. Volume indicators, however, show a slight decrease in buying pressure.
Trend Indicators:
- Moving Averages (MA): The 5-day moving average is above the 10-day simple moving average, indicating a short-term bullish trend. The exponential moving average (EMA) is also trending upwards, supporting a bullish view.
- MACD: The MACD line is below the signal line but has been converging towards it, suggesting a potential bullish crossover in the near future.
Momentum Indicators:
- RSI: The Relative Strength Index (RSI) is in the neutral zone around 50, indicating a balanced momentum.
- Stochastic Oscillator: Both %K and %D lines are in the overbought zone, suggesting a potential reversal or consolidation.
Volatility Indicators:
- Bollinger Bands (BB): The bands are narrowing, indicating decreasing volatility and a potential price breakout in the near future.
Volume Indicators:
- On-Balance Volume (OBV): The OBV has shown a slight decrease, indicating a decrease in buying pressure.
- Chaikin Money Flow (CMF): The CMF is negative, suggesting a bearish money flow trend.
Key Observations:
- The trend indicators suggest a bullish sentiment in the short term.
- Momentum indicators show a neutral to slightly overbought condition.
- Volatility is decreasing, indicating a potential price breakout.
- Volume indicators show a slight decrease in buying pressure.
Conclusion:
Based on the analysis of technical indicators, the next few days' possible stock price movement for CHGX is likely to be bullish in the short term. The trend indicators support a bullish view, with moving averages trending upwards and a potential bullish crossover in the MACD. However, caution is advised as momentum indicators show a slightly overbought condition, and volume indicators indicate a decrease in buying pressure. Traders should monitor the price action closely for any signs of reversal or consolidation.
Recommendation:
- Short-term Traders: Consider taking long positions with tight stop-loss levels to capitalize on the potential bullish momentum.
- Long-term Investors: Monitor the price action for a potential breakout and consider accumulating on dips for a long-term bullish view.
Always remember to conduct your own research and risk assessment before making any investment decisions.