Technical Analysis of CGCP 2024-05-10
Overview:
In analyzing the technical indicators for CGCP over the last 5 days, we will delve into the trend, momentum, volatility, and volume indicators to provide a comprehensive assessment of the stock's potential price movement. By examining these key factors, we aim to offer valuable insights and predictions for the next few days.
Trend Analysis:
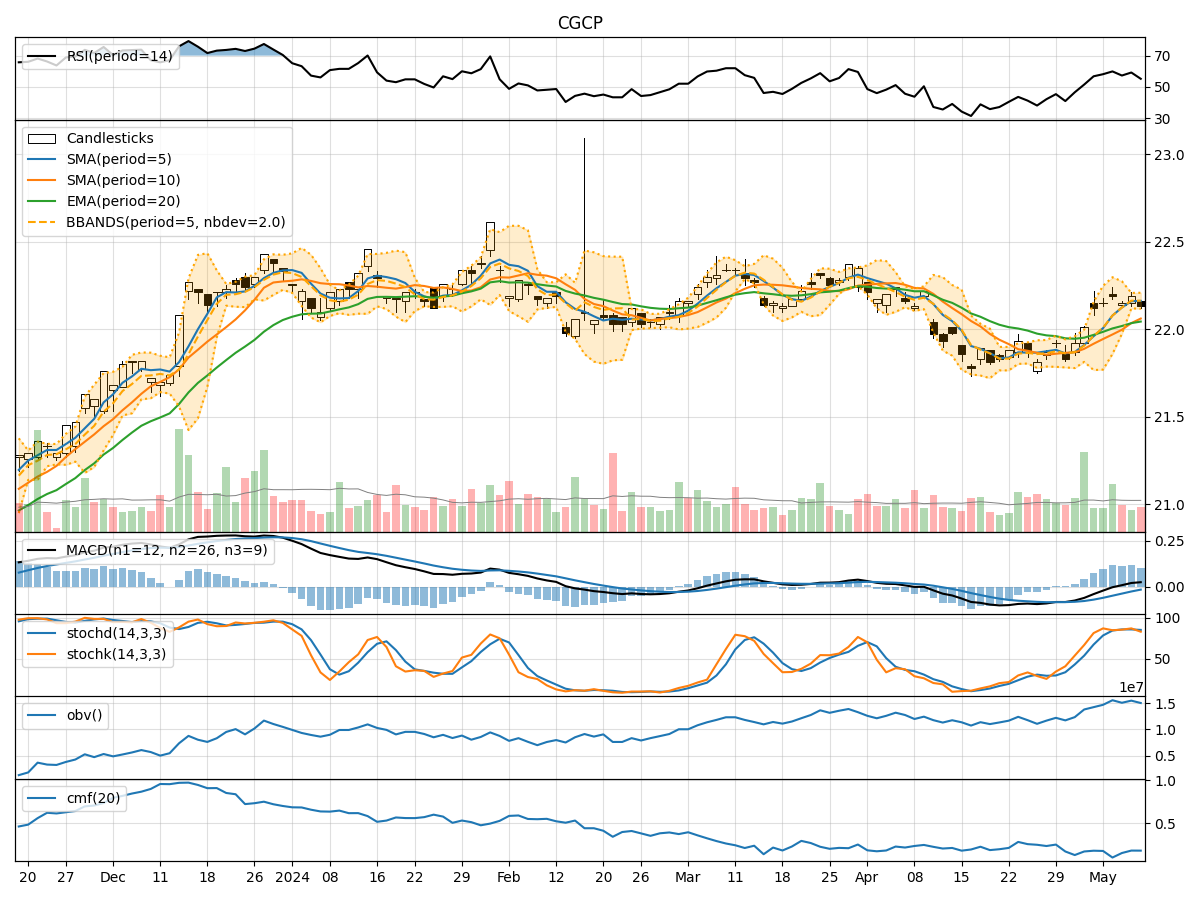
- Moving Averages (MA): The 5-day MA has been consistently above the closing price, indicating a short-term uptrend.
- MACD: The MACD line has been positive and above the signal line, suggesting bullish momentum.
- RSI: The RSI has been fluctuating around the 50 level, indicating a neutral stance.
Momentum Analysis:
- Stochastic Oscillator: The Stochastic indicators have shown overbought conditions, suggesting a potential reversal.
- Williams %R: The Williams %R is in oversold territory, signaling a possible buying opportunity.
Volatility Analysis:
- Bollinger Bands (BB): The stock price has been trading within the bands, indicating a period of consolidation.
- BB Width: The narrowing of the bands suggests decreasing volatility.
Volume Analysis:
- On-Balance Volume (OBV): The OBV has been relatively stable, indicating a balance between buying and selling pressure.
- Chaikin Money Flow (CMF): The CMF has been positive, reflecting buying pressure in the stock.
Key Observations:
- The stock is currently in a consolidation phase, as indicated by the narrowing Bollinger Bands and stable OBV.
- Momentum indicators suggest a potential reversal in the short term due to overbought conditions.
- The positive MACD and CMF signal underlying strength in the stock.
Conclusion:
Based on the analysis of the technical indicators, the next few days for CGCP are likely to see sideways movement with a potential for a short-term pullback. Traders should exercise caution as the stock may experience a period of consolidation before resuming its upward trend. It is advisable to closely monitor the Stochastic indicators for a clearer signal of a reversal.