Technical Analysis of CEW 2024-05-10
Overview:
In analyzing the technical indicators for CEW stock over the last 5 days, we will delve into the trend, momentum, volatility, and volume indicators to provide a comprehensive outlook on the possible stock price movement in the coming days. By examining these key indicators, we aim to offer valuable insights and predictions for potential investors.
Trend Analysis:
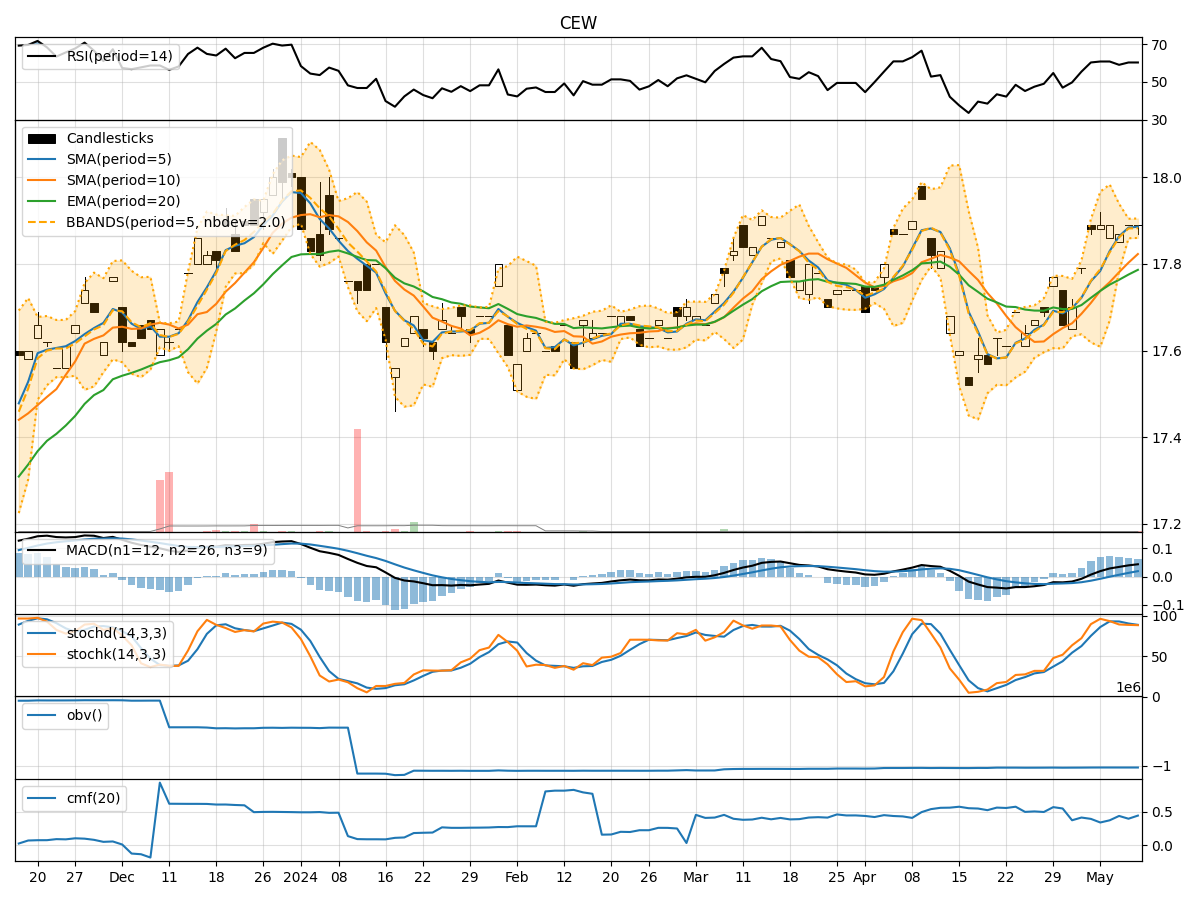
- Moving Averages (MA): The 5-day Moving Average (MA) has been consistently above the Simple Moving Average (SMA) and Exponential Moving Average (EMA), indicating a bullish trend.
- MACD: The MACD line has been consistently above the signal line, with both lines showing an upward trend, suggesting bullish momentum.
Momentum Analysis:
- RSI: The Relative Strength Index (RSI) has been hovering around 60, indicating a neutral stance in momentum.
- Stochastic Oscillator: Both %K and %D have been gradually decreasing but still remain in the overbought territory, signaling a potential reversal.
Volatility Analysis:
- Bollinger Bands (BB): The stock price has been trading within the Bollinger Bands, with the bands narrowing, indicating decreasing volatility.
Volume Analysis:
- On-Balance Volume (OBV): The OBV has been relatively stable, suggesting a balance between buying and selling pressure.
- Chaikin Money Flow (CMF): The CMF has been positive, indicating buying pressure in the stock.
Key Observations:
- The trend indicators suggest a strong bullish sentiment in the short term.
- Momentum indicators show a potential weakening of bullish momentum.
- Volatility has been decreasing, indicating a possible period of consolidation.
- Volume indicators reflect a balanced buying and selling pressure.
Conclusion:
Based on the analysis of the technical indicators, the next few days for CEW stock could see sideways movement or consolidation as the bullish trend may start to lose momentum. Investors should closely monitor the stochastic oscillator for a potential reversal in the overbought territory. Additionally, keeping an eye on the OBV and CMF for any shifts in buying pressure is crucial. Overall, a cautious approach is recommended, with a neutral to slightly bearish view on the stock price movement in the near term.