Technical Analysis of CATH 2024-05-10
Overview:
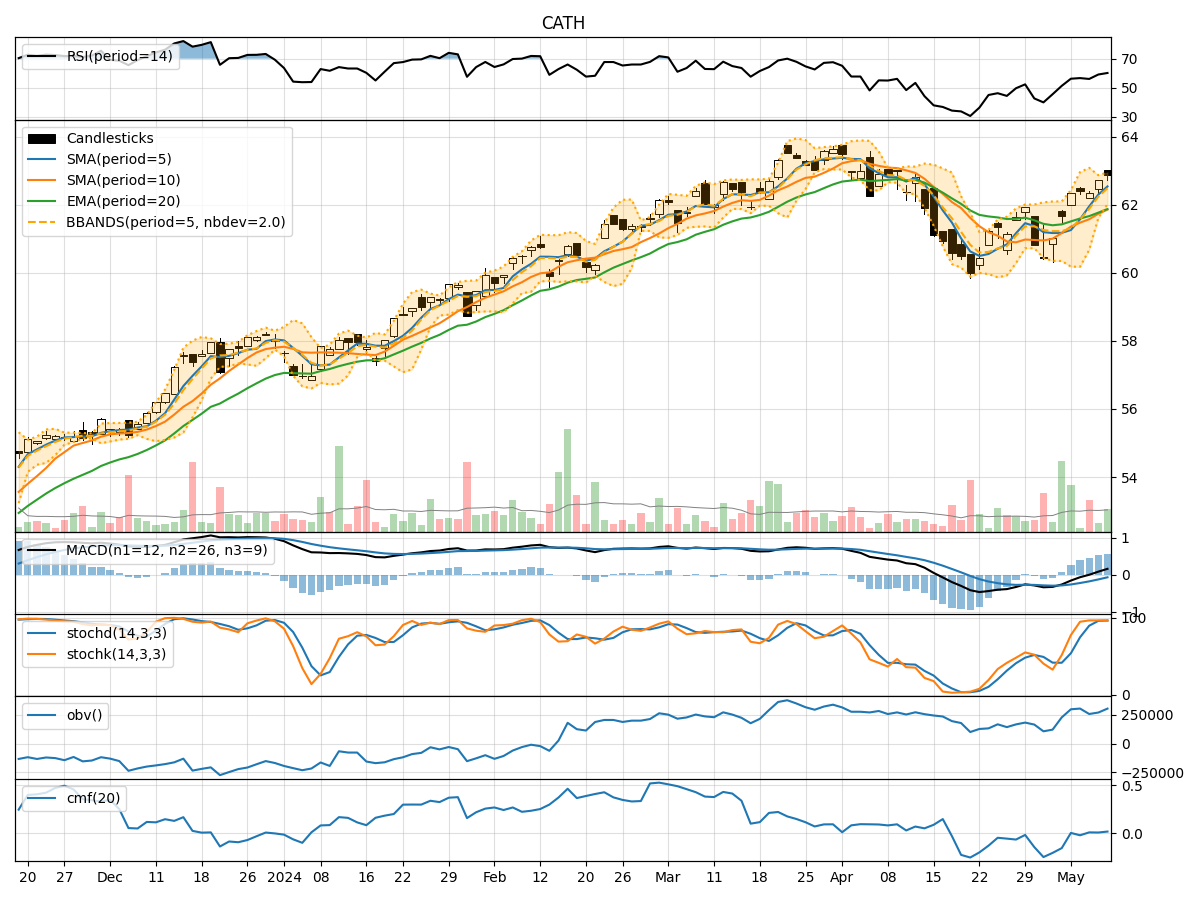
In analyzing the technical indicators for CATH stock over the last 5 days, we will delve into the trend, momentum, volatility, and volume indicators to provide a comprehensive outlook on the possible stock price movement in the coming days.
Trend Indicators:
- Moving Averages (MA): The 5-day MA has been consistently above the 10-day SMA, indicating a short-term bullish trend.
- Exponential Moving Average (EMA): The EMA has been showing an upward trend, suggesting positive momentum.
- Moving Average Convergence Divergence (MACD): The MACD line has been above the signal line, indicating a bullish signal.
- Conclusion: The trend indicators suggest an upward momentum in the stock price.
Momentum Indicators:
- Relative Strength Index (RSI): RSI has been trending upwards, indicating increasing buying pressure.
- Stochastic Oscillator: Both %K and %D have been in the overbought zone, suggesting a potential reversal.
- Williams %R (Willams %R): The indicator has been fluctuating around the oversold region.
- Conclusion: Momentum indicators show a mixed signal with potential for a short-term correction.
Volatility Indicators:
- Bollinger Bands (BB): The stock price has been trading within the bands, indicating normal volatility.
- Conclusion: Volatility indicators suggest a stable price movement with no extreme fluctuations.
Volume Indicators:
- On-Balance Volume (OBV): The OBV has been showing a slight increase, indicating accumulation.
- Chaikin Money Flow (CMF): The CMF has been positive, suggesting buying pressure.
- Conclusion: Volume indicators point towards positive accumulation and buying interest.
Overall Conclusion:
Based on the analysis of the technical indicators, the stock of CATH is likely to experience upward price movement in the coming days, supported by the bullish trend indicators and positive volume indicators. However, the mixed signals from the momentum indicators suggest a potential short-term correction or consolidation before resuming the upward trend. Traders should monitor the stochastic oscillator for a possible reversal and adjust their positions accordingly.
Key Recommendations:
- Long-Term Investors: Hold positions with a bullish outlook based on the trend indicators.
- Short-Term Traders: Be cautious of potential short-term corrections indicated by the momentum indicators.
- Risk Management: Set stop-loss orders to protect gains in case of a sudden reversal.
- Monitoring: Continuously monitor the stochastic oscillator for potential reversal signals.
In conclusion, while the overall outlook for CATH stock is bullish, traders should remain vigilant and adapt to changing market conditions to optimize their trading strategies.