Technical Analysis of CAML 2024-05-10
Overview:
In analyzing the technical indicators for CAML over the last 5 days, we will delve into the trend, momentum, volatility, and volume indicators to provide a comprehensive outlook on the possible stock price movement in the coming days. By examining these key aspects, we aim to offer valuable insights and predictions for potential investors.
Trend Analysis:
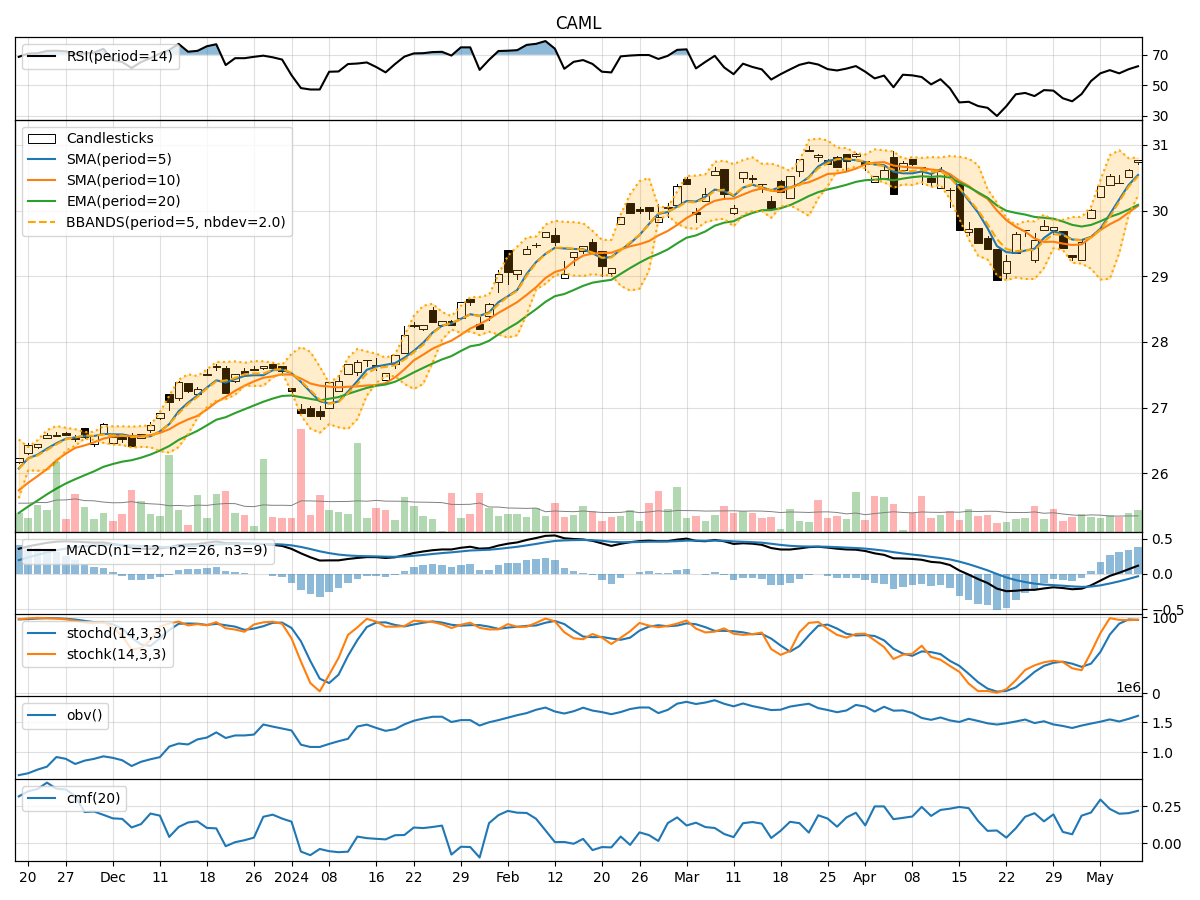
- Moving Averages (MA): The 5-day Moving Average (MA) has been consistently above the Simple Moving Average (SMA) and Exponential Moving Average (EMA), indicating a bullish trend.
- MACD: The MACD line has been consistently above the signal line, with both lines showing an upward trend, suggesting bullish momentum.
- MACD Histogram: The MACD Histogram has been increasing over the past 5 days, indicating strengthening bullish momentum.
Momentum Analysis:
- RSI: The Relative Strength Index (RSI) has been trending upwards and is currently in the overbought territory, suggesting a potential pullback.
- Stochastic Oscillator: Both %K and %D lines of the Stochastic Oscillator are in the overbought zone, indicating a possible reversal.
- Williams %R: The Williams %R is also in the overbought region, signaling a potential downward movement.
Volatility Analysis:
- Bollinger Bands: The stock price has been trading within the Bollinger Bands, with the bands narrowing over the last few days, indicating decreasing volatility.
- Bollinger %B: The %B indicator is currently above 0.8, suggesting that the stock is trading near the upper band, potentially indicating an overbought condition.
Volume Analysis:
- On-Balance Volume (OBV): The OBV has been fluctuating but overall showing a slight decrease, indicating some distribution happening in the stock.
- Chaikin Money Flow (CMF): The CMF has been positive over the last 5 days, indicating buying pressure in the stock.
Conclusion:
Based on the analysis of the technical indicators, the stock of CAML is currently exhibiting overbought conditions in terms of momentum indicators like RSI, Stochastic Oscillator, and Williams %R. The trend indicators suggest a bullish trend with strong momentum, while volatility is decreasing. The volume indicators show some distribution happening in the stock.
Possible Stock Price Movement:
Considering the overbought signals from momentum indicators and the potential for a pullback, coupled with the decreasing volatility and distribution in volume, it is likely that the stock price of CAML may experience a short-term correction or consolidation in the coming days. Traders should be cautious of a possible downward movement or sideways trading pattern in the near future.