Technical Analysis of CA 2024-05-10
Overview:
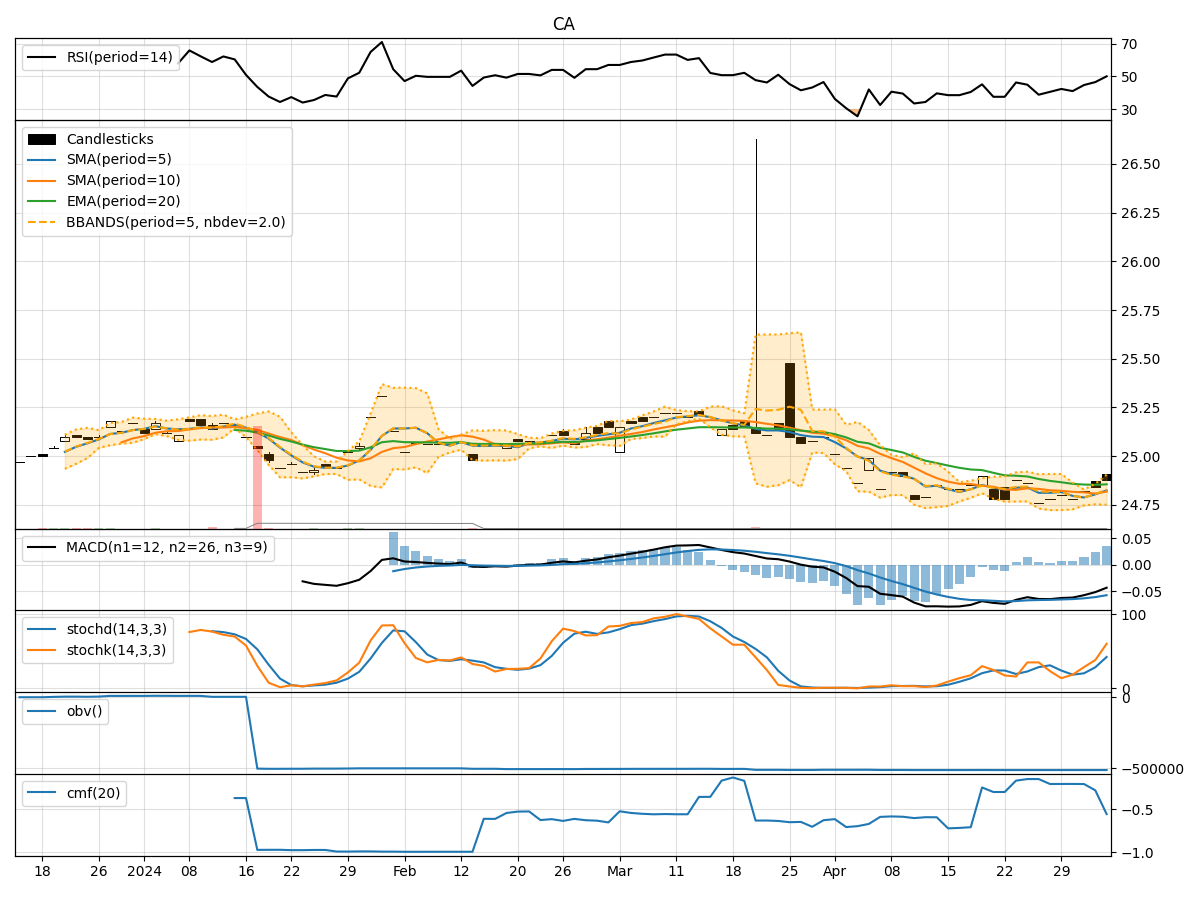
In the last 5 trading days, the stock price of CA has shown a slight upward trend, with incremental increases in closing prices. Various technical indicators have been analyzed to provide insights into the potential future movement of the stock price. The trend, momentum, volatility, and volume indicators have been examined to form a comprehensive analysis.
Trend Indicators:
- Moving Averages (MA): The moving averages have been gradually increasing, indicating a positive trend in the stock price.
- MACD (Moving Average Convergence Divergence): The MACD line has been consistently above the signal line, suggesting bullish momentum.
- RSI (Relative Strength Index): The RSI is in the neutral zone, indicating neither overbought nor oversold conditions.
Key Observation: The trend indicators suggest a bullish outlook for the stock price.
Momentum Indicators:
- Stochastic Oscillator: Both %K and %D values are in the overbought territory, indicating potential price reversal.
- Williams %R: The Williams %R is in the oversold region, suggesting a possible buying opportunity.
Key Observation: The momentum indicators show conflicting signals, with stochastic indicating a bearish view and Williams %R suggesting a bullish stance.
Volatility Indicators:
- Bollinger Bands: The stock price has been trading within the bands, with the upper band acting as resistance.
- Bollinger %B: The %B value is below 1, indicating the price is below the upper band.
Key Observation: Volatility indicators imply a sideways movement with a slight bearish bias due to the resistance at the upper Bollinger Band.
Volume Indicators:
- On-Balance Volume (OBV): The OBV has been declining, suggesting selling pressure in the stock.
- Chaikin Money Flow (CMF): The CMF is negative, indicating a lack of buying interest.
Key Observation: Volume indicators point towards a bearish sentiment in the stock.
Conclusion:
Based on the analysis of trend, momentum, volatility, and volume indicators, the next few days' possible stock price movement for CA is likely to be sideways to slightly bearish. The conflicting signals from momentum indicators and the negative sentiment from volume indicators suggest a lack of strong buying interest to drive the price higher. Traders should exercise caution and consider waiting for clearer signals before making significant trading decisions.
Recommendation:
- Short-term Traders: Consider staying on the sidelines or adopting a cautious approach due to the mixed signals.
- Long-term Investors: Monitor the price action closely and wait for a clearer trend confirmation before making any investment decisions.
Always remember to conduct your analysis and consider multiple factors before making any investment decisions.