Technical Analysis of BUXX 2024-05-10
Overview:
In analyzing the technical indicators for BUXX over the last 5 days, we will delve into the trend, momentum, volatility, and volume indicators to provide a comprehensive outlook on the possible stock price movement in the coming days. By examining these key aspects, we aim to offer valuable insights and predictions for informed decision-making.
Trend Analysis:
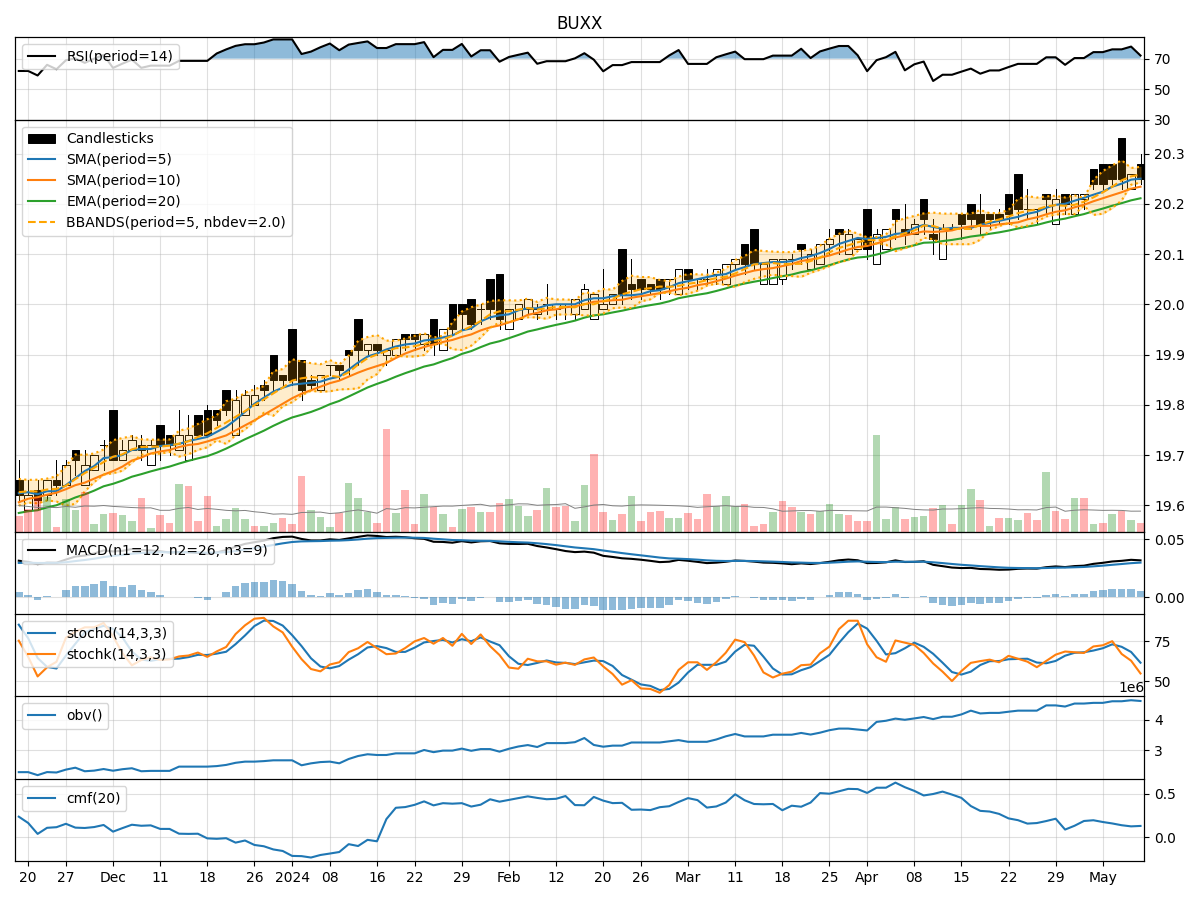
- Moving Averages (MA): The moving averages show a consistent uptrend with the closing prices above the short-term (5-day) and medium-term (10-day) moving averages. This indicates a positive trend in the stock price.
- MACD: The MACD line is above the signal line, suggesting bullish momentum in the stock.
- EMA: The exponential moving average is also trending upwards, supporting the bullish sentiment.
Momentum Analysis:
- RSI: The Relative Strength Index (RSI) is in the overbought territory, indicating a potential reversal or consolidation in the stock price.
- Stochastic Oscillator: Both %K and %D are declining, signaling a potential bearish momentum.
- Williams %R: The Williams %R is in the oversold region, suggesting a possible reversal in the stock price.
Volatility Analysis:
- Bollinger Bands: The Bollinger Bands are narrowing, indicating decreasing volatility in the stock price.
- Bollinger %B: The %B is around 0.5, suggesting the stock is trading at the middle of the bands.
Volume Analysis:
- On-Balance Volume (OBV): The OBV is showing a slight increase, indicating buying pressure in the stock.
- Chaikin Money Flow (CMF): The CMF is positive, suggesting money flow into the stock over the past 20 days.
Key Observations:
- The trend indicators suggest a bullish sentiment with moving averages and MACD supporting an upward trend.
- Momentum indicators show conflicting signals with RSI in overbought territory and stochastic oscillators hinting at a potential bearish reversal.
- Volatility is decreasing, indicating a possible period of consolidation or a calm before a potential price movement.
- Volume indicators show a slight increase in buying pressure, supporting the bullish outlook.
Conclusion:
Based on the analysis of the technical indicators, the stock price of BUXX is likely to experience a period of consolidation in the near term. While the trend indicators remain bullish, the conflicting signals from momentum indicators and the decreasing volatility suggest a potential pause in the upward movement. Traders should exercise caution and monitor key support and resistance levels for potential entry or exit points.