Technical Analysis of BSMV 2024-05-10
Overview:
In analyzing the technical indicators for BSMV stock over the last 5 days, we will delve into the trend, momentum, volatility, and volume indicators to provide a comprehensive outlook on the possible stock price movement in the coming days. By examining these key indicators, we aim to offer valuable insights and recommendations for potential investors.
Trend Analysis:
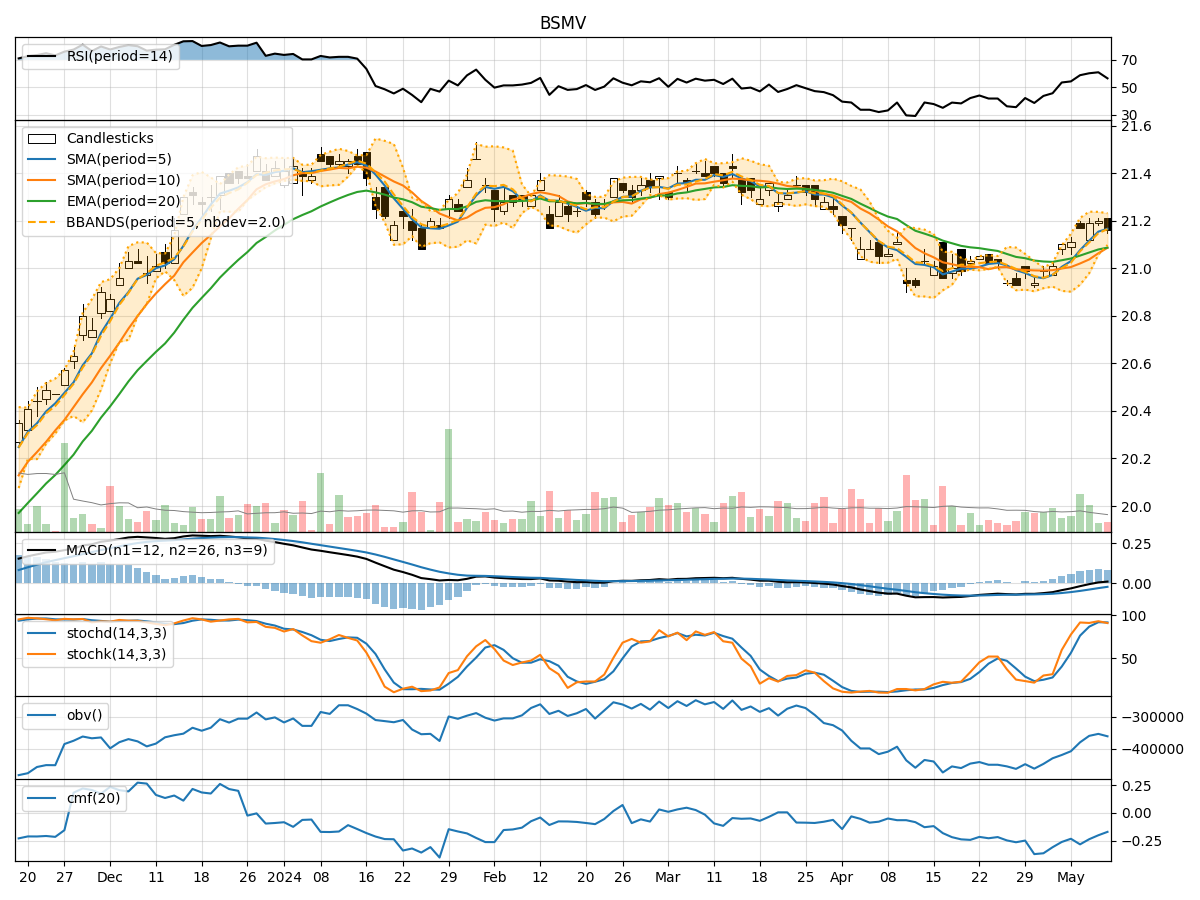
- Moving Averages (MA): The 5-day MA has been consistently above the closing prices, indicating a short-term uptrend.
- MACD: The MACD line has been above the signal line, suggesting a bullish momentum.
- RSI: The RSI has been fluctuating around the 50 level, indicating a neutral stance.
Momentum Analysis:
- Stochastic Oscillator: Both %K and %D have been in the overbought zone, signaling a potential reversal.
- Williams %R: The indicator has been in the oversold territory, hinting at a possible buying opportunity.
Volatility Analysis:
- Bollinger Bands (BB): The stock price has been trading within the bands, showing a stable price range.
- BB Width: The narrowing of the bands suggests decreasing volatility.
Volume Analysis:
- On-Balance Volume (OBV): The OBV has been negative, indicating distribution.
- Chaikin Money Flow (CMF): The CMF has been negative, reflecting selling pressure.
Key Observations:
- The trend indicators suggest a bullish sentiment in the short term.
- Momentum indicators show conflicting signals with stochastic in overbought territory and Williams %R in oversold territory.
- Volatility is decreasing, indicating a potential consolidation phase.
- Volume indicators point towards distribution and selling pressure.
Conclusion:
Based on the analysis of the technical indicators, the next few days' possible stock price movement for BSMV is likely to experience a consolidation phase with sideways trading. The conflicting signals from momentum indicators and the negative volume indicators suggest a lack of clear direction in the near term. Investors should exercise caution and closely monitor the price action for any potential breakout or reversal signals before making trading decisions.