Technical Analysis of BSJR 2024-05-10
Overview:
In analyzing the technical indicators for BSJR stock over the last 5 days, we will delve into the trends, momentum, volatility, and volume indicators to provide a comprehensive outlook on the possible future stock price movement. By examining these key aspects, we aim to offer valuable insights and predictions for the upcoming trading days.
Trend Analysis:
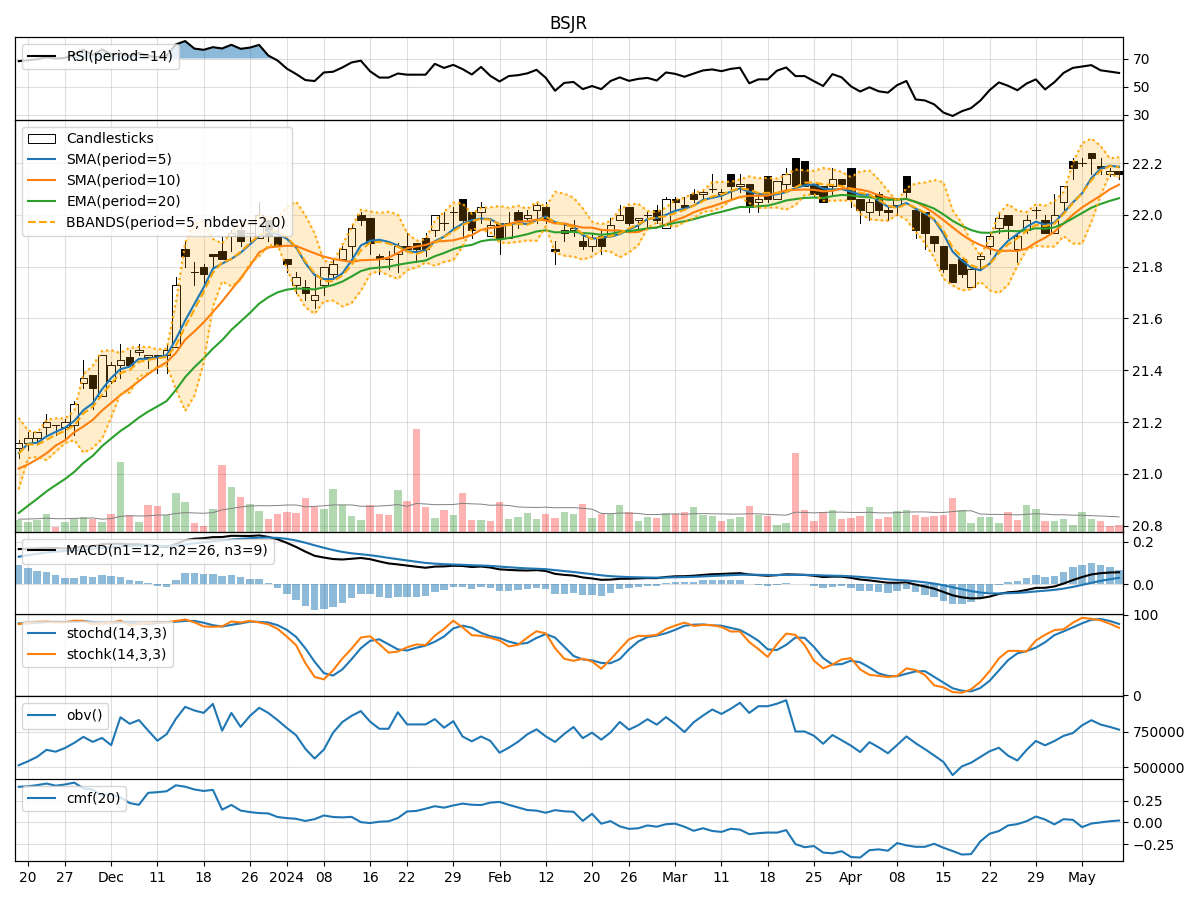
- Moving Averages (MA): The 5-day Moving Average (MA) has been relatively stable around the closing prices, indicating a consistent trend in the short term.
- MACD and Signal Line: The MACD line has been consistently positive, indicating bullish momentum in the stock price.
- Relative Strength Index (RSI): The RSI values have been fluctuating around the 60-65 range, suggesting moderate strength in the stock.
Key Observation: The trend indicators suggest a bullish sentiment in the stock price movement.
Momentum Analysis:
- Stochastic Oscillator: The Stochastic Oscillator values have been gradually decreasing, indicating a potential reversal in momentum.
- Williams %R (Willr): The Williams %R values have been consistently negative, suggesting an oversold condition.
Key Observation: The momentum indicators point towards a potential downward movement in the stock price.
Volatility Analysis:
- Bollinger Bands (BB): The Bollinger Bands have been narrowing, indicating decreasing volatility in the stock price.
- Bollinger Band %B (bbp): The %B values have been decreasing, suggesting a potential consolidation phase.
Key Observation: The volatility indicators signal a sideways or consolidation phase in the stock price.
Volume Analysis:
- On-Balance Volume (OBV): The OBV values have been fluctuating, indicating mixed buying and selling pressure.
- Chaikin Money Flow (CMF): The CMF values have been hovering around the zero line, suggesting a balance between buying and selling pressure.
Key Observation: The volume indicators reflect a neutral stance in the stock price movement.
Conclusion:
Based on the analysis of trend, momentum, volatility, and volume indicators, the overall outlook for BSJR stock in the next few days is as follows: - Trend: Upward - Momentum: Downward - Volatility: Sideways/Consolidation - Volume: Neutral
Considering the mixed signals from different indicators, it is likely that the stock may experience some volatility and consolidation in the near term. Traders should exercise caution and closely monitor key levels for potential entry or exit points.
Final Recommendation:
Given the conflicting signals from the technical indicators, it is advisable to wait for more clarity in the stock price movement before making any significant trading decisions. Keep a close eye on key support and resistance levels to gauge the direction of the stock price accurately.