Technical Analysis of BSJO 2024-05-10
Overview:
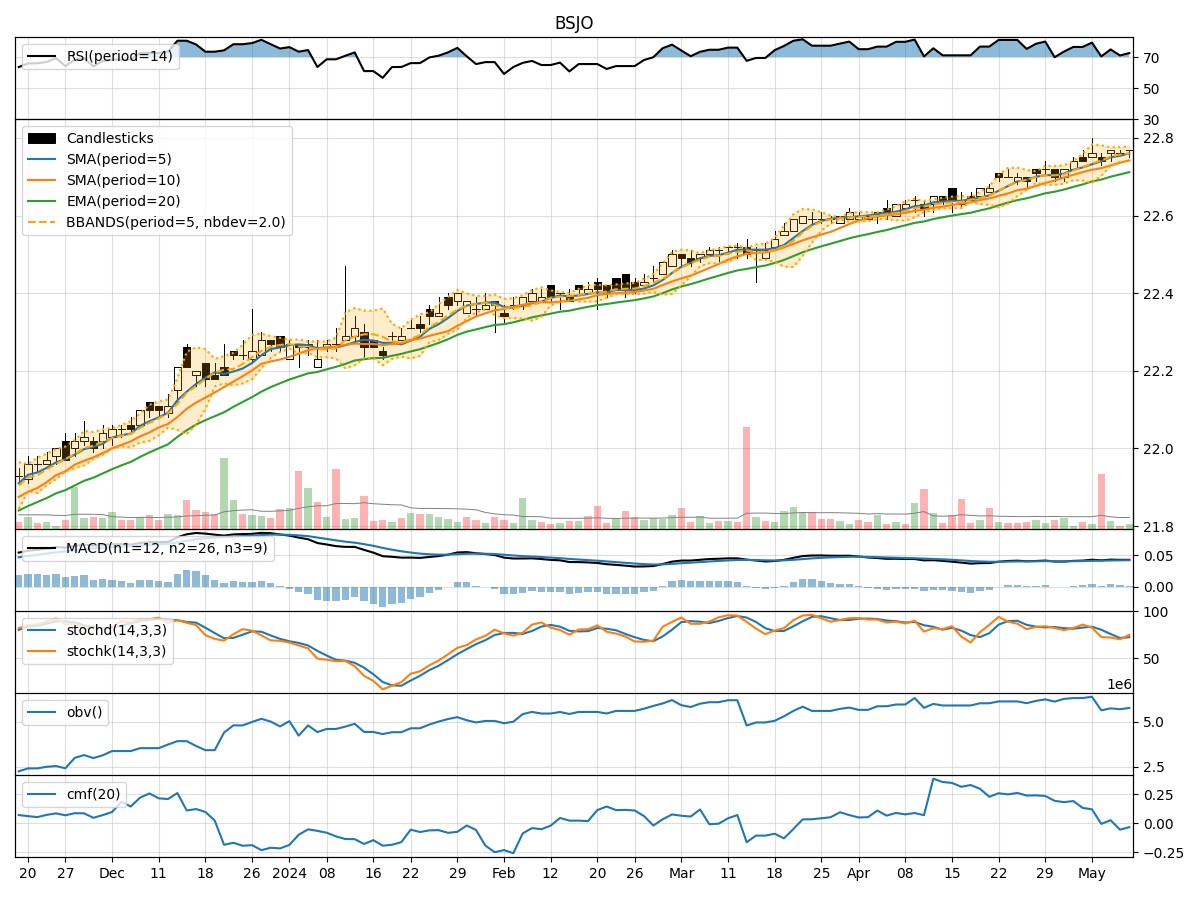
In analyzing the technical indicators for BSJO stock over the last 5 days, we will delve into the trend, momentum, volatility, and volume indicators to provide a comprehensive outlook on the possible stock price movement in the coming days. By examining these key indicators, we aim to offer valuable insights and predictions for potential investors.
Trend Analysis:
- Moving Averages (MA): The moving averages show a consistent uptrend with the closing price above the MA values, indicating a positive trend.
- MACD: The MACD line is above the signal line, suggesting bullish momentum in the stock.
- RSI: The RSI values are in the overbought region, indicating a potential reversal or consolidation.
Momentum Analysis:
- Stochastic Oscillator: The stochastic indicators are fluctuating but generally in the overbought region, signaling a possible reversal or consolidation.
- Williams %R (WillR): The Williams %R values are in the oversold region, indicating a potential buying opportunity.
Volatility Analysis:
- Bollinger Bands (BB): The stock price is within the Bollinger Bands, suggesting a period of consolidation or stability.
- BB% (BB Percentage): The BB% values are fluctuating around the midline, indicating a balanced market sentiment.
Volume Analysis:
- On-Balance Volume (OBV): The OBV values are mixed, indicating indecision among investors regarding the stock.
- Chaikin Money Flow (CMF): The CMF values are negative, suggesting selling pressure in the stock.
Conclusion:
Based on the analysis of the technical indicators, the stock is currently in a consolidation phase with mixed signals across different indicators. The trend is positive, supported by moving averages and MACD, but the momentum and volatility indicators suggest a possible reversal or consolidation in the near term. The volume indicators also reflect uncertainty among investors.
Recommendation:
Considering the mixed signals and the potential for a reversal or consolidation, it is advisable for investors to exercise caution and closely monitor the stock's price action in the coming days. Wait for confirmation of a clear trend before making any significant trading decisions. It is essential to consider both technical indicators and market sentiment to make informed investment choices.
Disclaimer:
Remember that technical analysis is not a guaranteed predictor of future price movements, and other fundamental factors can influence stock prices. It is crucial to conduct thorough research and consider multiple indicators before making any investment decisions. Consulting with a financial advisor can provide personalized insights tailored to your investment goals and risk tolerance.