Technical Analysis of BSCS 2024-05-10
Overview:
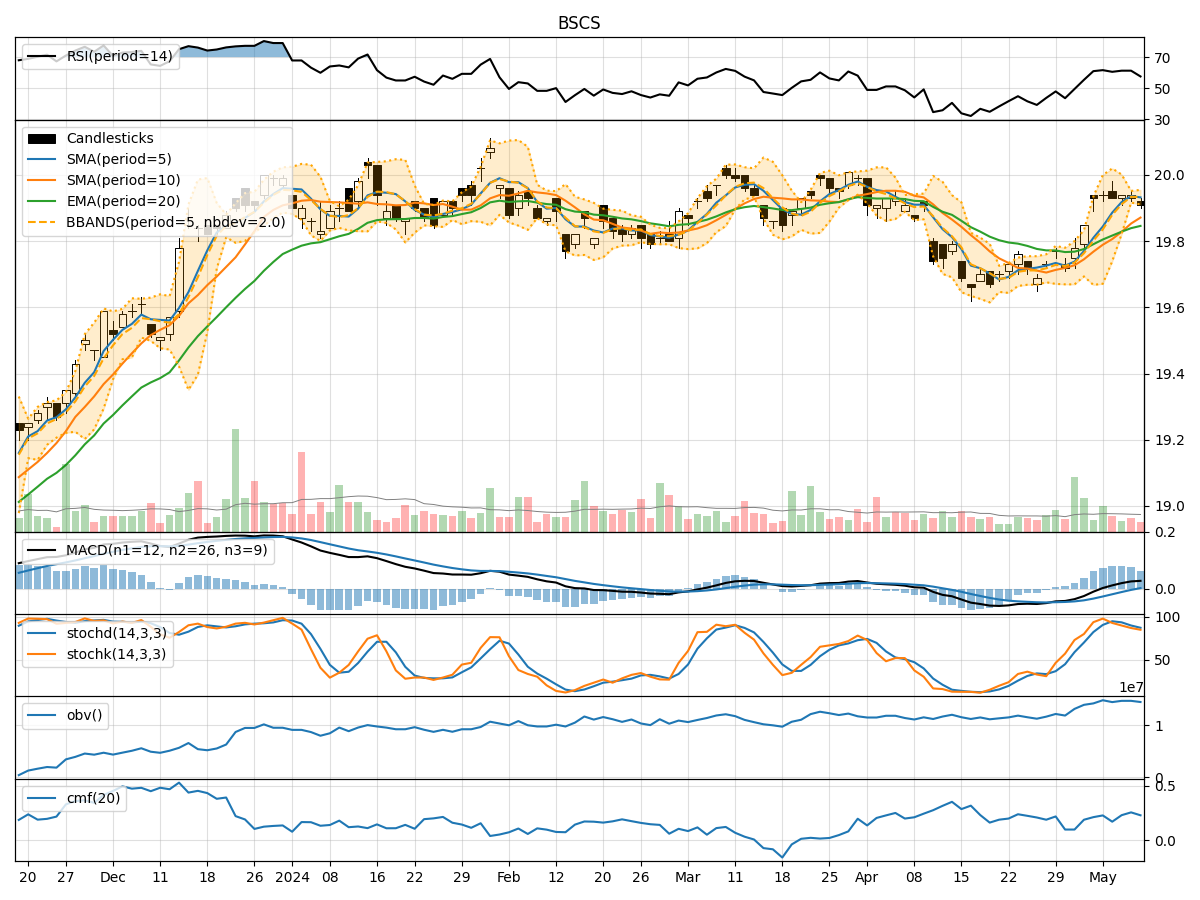
In the last 5 trading days, BSCS stock has shown relatively stable price movements with minor fluctuations. The technical indicators provide insights into the trend, momentum, volatility, and volume of the stock. By analyzing these indicators, we can make informed predictions about the possible future price movements of BSCS stock.
Trend Analysis:
- Moving Averages (MA): The 5-day Moving Average (MA) has been consistently close to the actual closing prices, indicating a stable trend.
- MACD: The Moving Average Convergence Divergence (MACD) has shown a slight positive trend, with the MACD line crossing above the signal line, suggesting a potential bullish momentum.
- RSI: The Relative Strength Index (RSI) has been fluctuating around the 60-70 range, indicating a neutral sentiment in the market.
Momentum Analysis:
- Stochastic Oscillator: The Stochastic Oscillator shows that the stock is not in overbought or oversold territory, suggesting a balanced momentum.
- Williams %R: The Williams %R indicator is hovering around -20 to -30, indicating a slightly bearish sentiment.
Volatility Analysis:
- Bollinger Bands: The Bollinger Bands are relatively narrow, indicating low volatility in the stock price.
- Volatility Bands: The Volatility Bands show that the stock price has been trading within a tight range, suggesting stability.
Volume Analysis:
- On-Balance Volume (OBV): The OBV indicator has been relatively stable, indicating consistent buying and selling pressure.
- Chaikin Money Flow (CMF): The CMF is positive, suggesting that money is flowing into the stock.
Key Observations:
- The trend indicators suggest a potential bullish momentum in the short term.
- Momentum indicators show a balanced momentum with a slightly bearish sentiment.
- Volatility indicators indicate low volatility and stability in the stock price.
- Volume indicators reflect consistent buying and selling pressure with money flowing into the stock.
Conclusion:
Based on the analysis of the technical indicators, the next few days' possible stock price movement for BSCS stock is likely to be bullish. The trend indicators point towards a positive momentum, supported by stable volatility and consistent buying pressure. However, it is essential to monitor the market closely for any sudden changes in trend or momentum. Investors may consider taking advantage of the potential upward movement in the stock price.