Technical Analysis of BOIL 2024-05-10
Overview:
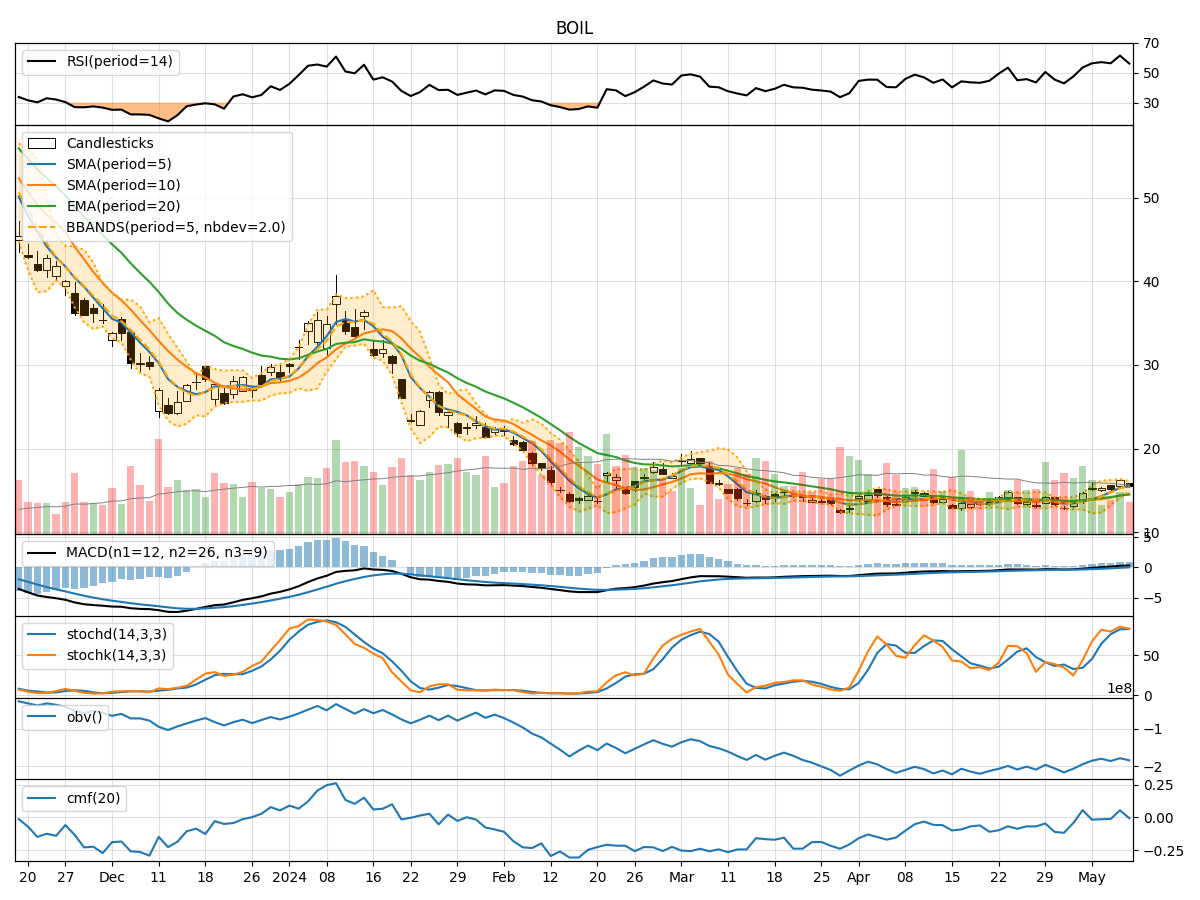
In analyzing the technical indicators for BOIL over the last 5 days, we will delve into the trend, momentum, volatility, and volume indicators to provide a comprehensive outlook on the possible stock price movement. By examining these key indicators, we aim to offer valuable insights and predictions for the upcoming days.
Trend Analysis:
- Moving Averages (MA): The 5-day Moving Average has been consistently above the Simple Moving Average (SMA) and Exponential Moving Average (EMA), indicating a bullish trend.
- MACD: The MACD line has been above the signal line for the past few days, suggesting a bullish momentum.
Key Observation: The trend indicators point towards a bullish sentiment in the stock price movement.
Momentum Analysis:
- RSI: The Relative Strength Index (RSI) has been fluctuating around the 50 level, indicating a neutral momentum.
- Stochastic Oscillator: Both %K and %D have been in the overbought zone, suggesting a potential reversal.
Key Observation: The momentum indicators suggest a neutral to bearish outlook for the stock.
Volatility Analysis:
- Bollinger Bands (BB): The stock price has been trading within the Bollinger Bands, with the bands narrowing, indicating reduced volatility.
Key Observation: Volatility has been decreasing, signaling a consolidation phase in the stock price.
Volume Analysis:
- On-Balance Volume (OBV): The OBV has been fluctuating, indicating indecision among investors.
- Chaikin Money Flow (CMF): The CMF has been negative, suggesting selling pressure in the stock.
Key Observation: Volume indicators reflect a mixed sentiment among market participants.
Conclusion:
Based on the analysis of the technical indicators, the stock is likely to experience sideways movement in the upcoming days. While the trend indicators point towards a bullish sentiment, the momentum indicators suggest a neutral to bearish outlook. The decreasing volatility indicates a consolidation phase, and the volume indicators reflect indecision among investors. Therefore, it is recommended to closely monitor the stock for potential reversals or breakout opportunities.
Recommendation:
- Short-term Traders: Consider staying cautious and wait for clearer signals before taking any significant positions.
- Long-term Investors: Monitor the stock closely for any developments that could provide clarity on the future direction.
In conclusion, the stock is expected to trade sideways in the near term, with potential for a shift in momentum based on market developments. It is crucial to remain vigilant and adapt to changing market conditions for optimal decision-making.