Technical Analysis of BNDW 2024-05-10
Overview:
In analyzing the technical indicators for BNDW over the last 5 days, we will delve into the trend, momentum, volatility, and volume indicators to provide a comprehensive outlook on the possible stock price movement in the coming days.
Trend Analysis:
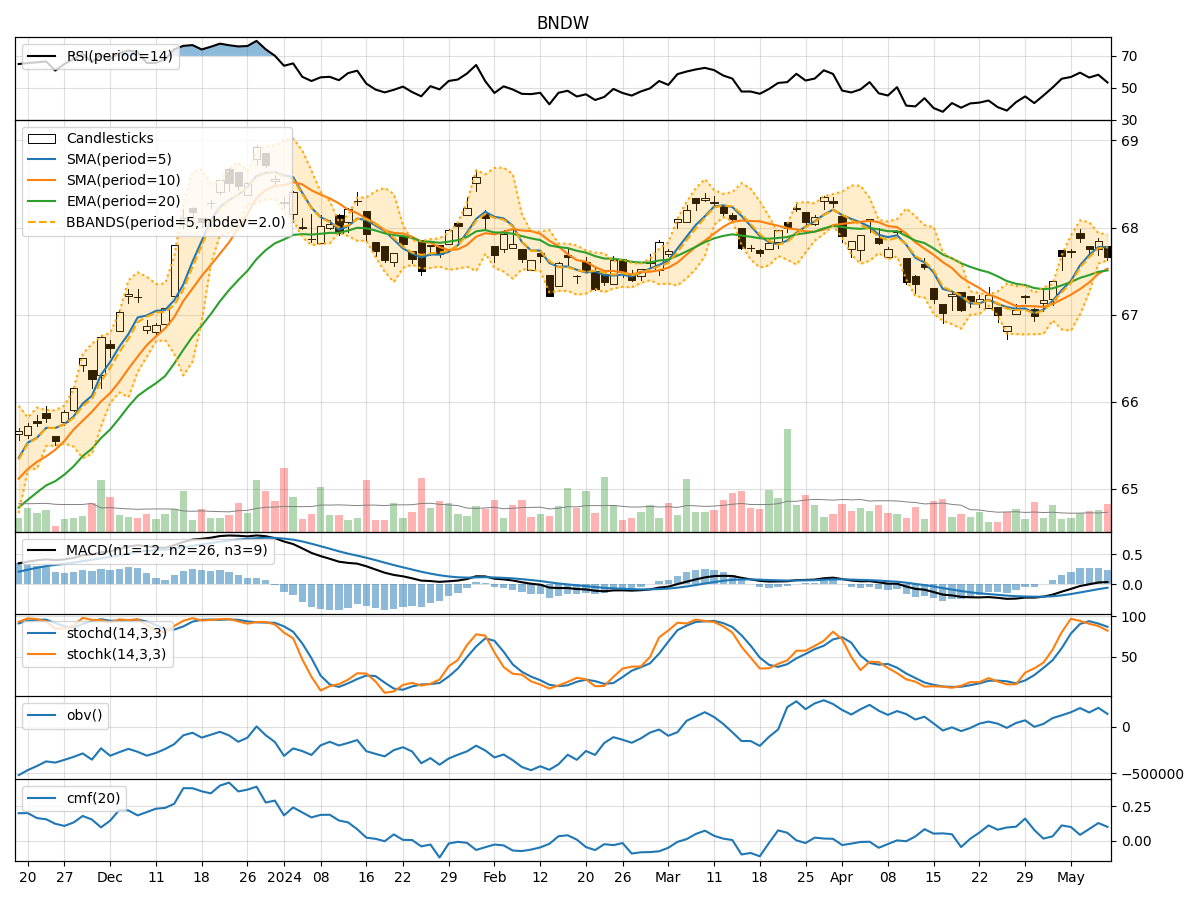
- Moving Averages (MA): The 5-day Moving Average (MA) has been consistently above the Simple Moving Average (SMA) and Exponential Moving Average (EMA), indicating a short-term bullish trend.
- MACD: The MACD line has been consistently above the signal line, with the MACD Histogram showing an increasing positive trend, suggesting bullish momentum.
Momentum Analysis:
- RSI: The Relative Strength Index (RSI) has been fluctuating around the neutral zone, indicating a lack of strong momentum in either direction.
- Stochastic Oscillator: Both %K and %D have been decreasing, moving towards the oversold territory, signaling a potential reversal to the upside.
- Williams %R: The Williams %R is in the oversold region, suggesting a possible buying opportunity.
Volatility Analysis:
- Bollinger Bands (BB): The stock price has been trading within the Bollinger Bands, with the bands narrowing, indicating decreasing volatility.
- Bollinger %B: The %B indicator is currently below 1, suggesting the price is below the lower band, potentially indicating an oversold condition.
Volume Analysis:
- On-Balance Volume (OBV): The OBV has been fluctuating, indicating mixed buying and selling pressure.
- Chaikin Money Flow (CMF): The CMF has been positive, suggesting accumulation in the stock.
Key Observations:
- The trend indicators suggest a bullish sentiment in the short term.
- Momentum indicators show a lack of strong momentum but hint at a potential reversal.
- Volatility indicators point towards decreasing volatility.
- Volume indicators indicate mixed buying and selling pressure but with a slight bias towards accumulation.
Conclusion:
Based on the analysis of the technical indicators, the next few days for BNDW could see a sideways consolidation with a slight upward bias. Traders may consider monitoring the stochastic oscillator for a potential reversal confirmation and the RSI for any signs of increasing momentum. Additionally, keeping an eye on the Bollinger Bands for a breakout or breakdown could provide valuable insights into the stock's price movement.