Technical Analysis of BNDD 2024-05-10
Overview:
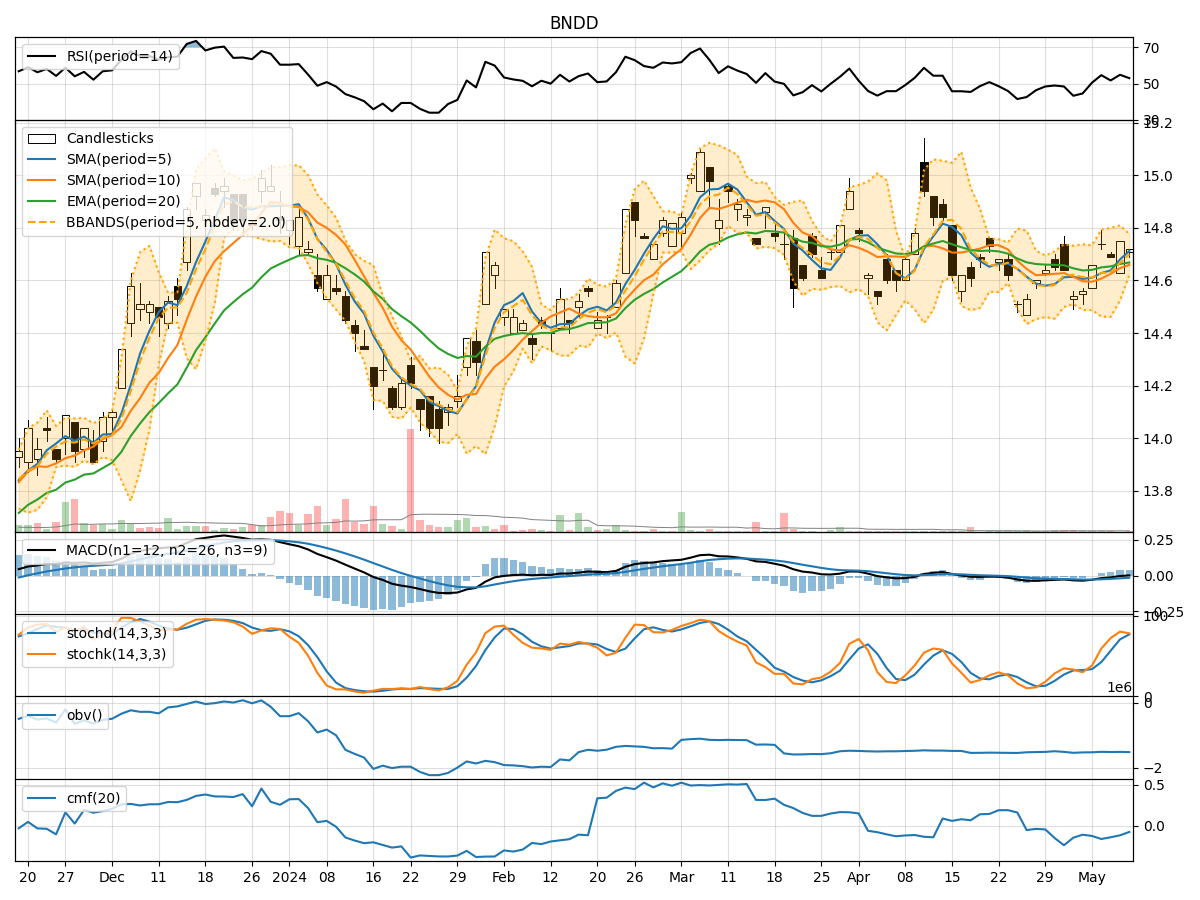
In analyzing the technical indicators for BNDD over the last 5 days, we will delve into the trend, momentum, volatility, and volume indicators to provide a comprehensive outlook on the possible stock price movement in the coming days.
Trend Analysis:
- Moving Averages (MA): The 5-day Moving Average (MA) has been showing a slight uptrend, with the stock price consistently above the MA line.
- MACD: The Moving Average Convergence Divergence (MACD) indicator has been gradually increasing, indicating a potential bullish momentum.
- EMA: The Exponential Moving Average (EMA) has been trending slightly upwards, supporting the bullish sentiment.
Momentum Analysis:
- RSI: The Relative Strength Index (RSI) has been hovering around the neutral zone, suggesting a balanced momentum.
- Stochastic Oscillator: Both %K and %D have been in the overbought territory, indicating a potential reversal or consolidation.
- Williams %R: The Williams %R is showing oversold conditions, signaling a possible buying opportunity.
Volatility Analysis:
- Bollinger Bands: The Bollinger Bands are narrowing, indicating decreasing volatility and a potential price breakout.
- Bollinger %B: The %B indicator is below 1, suggesting the stock is trading below the lower band and may be oversold.
Volume Analysis:
- On-Balance Volume (OBV): The OBV has been relatively stable, indicating a balance between buying and selling pressure.
- Chaikin Money Flow (CMF): The CMF is negative, suggesting outflow of money from the stock.
Key Observations:
- The trend indicators suggest a bullish sentiment with the MA and MACD pointing towards a potential uptrend.
- Momentum indicators show mixed signals with RSI neutral, Stochastic overbought, and Williams %R oversold.
- Volatility indicators indicate a potential breakout as the Bollinger Bands narrow.
- Volume indicators reflect a balance between buying and selling pressure, with a slight outflow of money from the stock.
Conclusion:
Based on the analysis of the technical indicators, the next few days' possible stock price movement for BNDD is likely to be bullish. The trend indicators support a potential uptrend, while volatility signals a breakout. However, mixed momentum signals suggest a possible consolidation or minor pullback before resuming the upward trajectory. Traders should closely monitor key levels and wait for confirmation of the bullish trend before entering positions.