Technical Analysis of BND 2024-05-10
Overview:
In analyzing the technical indicators for BND over the last 5 days, we will delve into the trend, momentum, volatility, and volume indicators to provide a comprehensive outlook on the possible stock price movement in the coming days. By examining these key aspects, we aim to offer valuable insights and predictions to guide your investment decisions.
Trend Indicators:
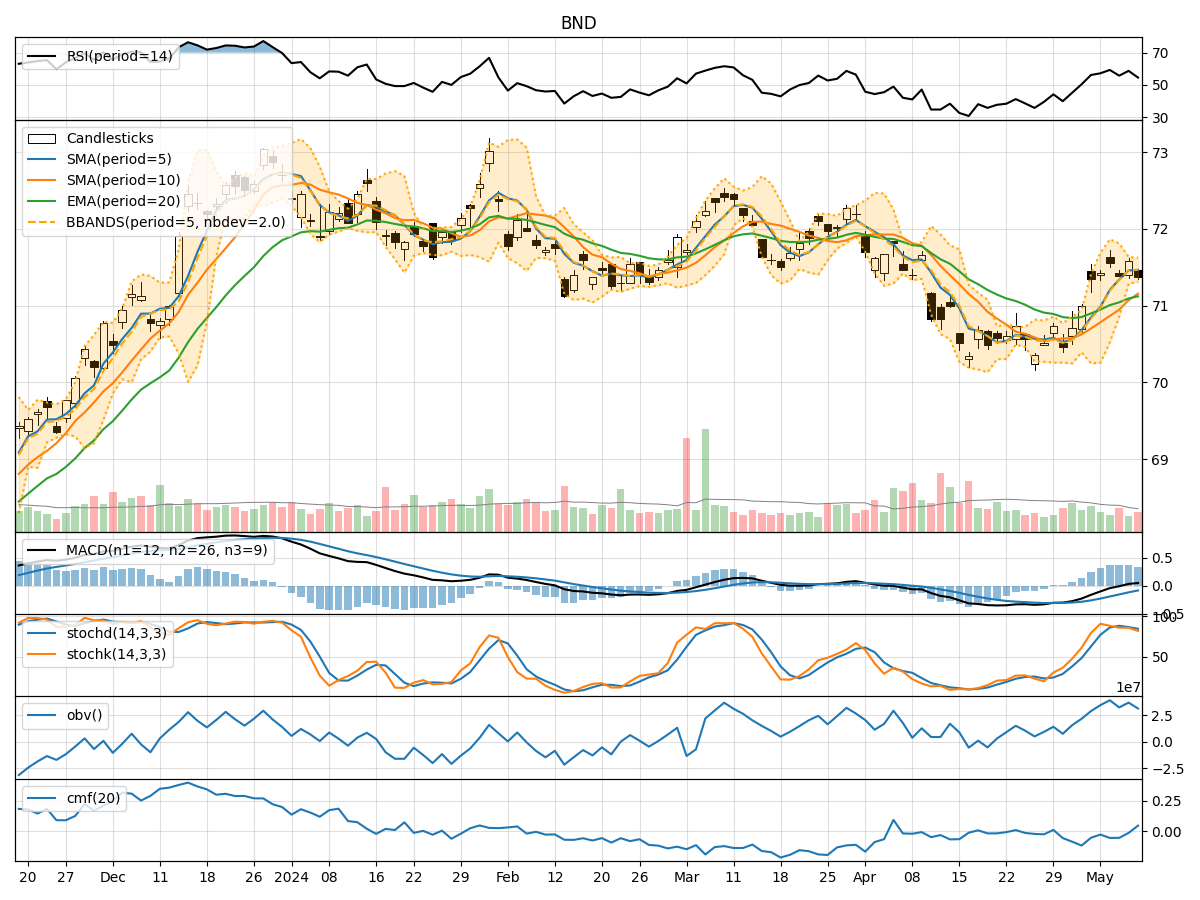
- Moving Averages (MA): The 5-day moving average has been relatively stable around the mid-$71 range, indicating a neutral trend.
- MACD: The MACD line has shown slight positive momentum, with the MACD histogram moving towards the zero line, suggesting a potential shift towards bullish sentiment.
- RSI: The RSI has been fluctuating around the mid-50s, reflecting a balanced market sentiment without any extreme overbought or oversold conditions.
Momentum Indicators:
- Stochastic Oscillator: The stochastic oscillator has been gradually declining but remains in the neutral zone, indicating a lack of strong momentum in either direction.
- Williams %R: The Williams %R indicator has been hovering in the oversold territory, suggesting a potential buying opportunity in the near term.
Volatility Indicators:
- Bollinger Bands: The Bollinger Bands have been narrowing, indicating decreasing volatility and a possible period of consolidation.
- Average True Range (ATR): The ATR has shown a decline in volatility, further supporting the consolidation phase.
Volume Indicators:
- On-Balance Volume (OBV): The OBV has been relatively stable, suggesting a balance between buying and selling pressure.
- Chaikin Money Flow (CMF): The CMF has been negative, indicating a slight outflow of money from the stock.
Key Observations and Opinions:
- Trend: The trend indicators suggest a neutral outlook with a slight bullish bias based on the MACD.
- Momentum: Momentum indicators indicate a lack of strong momentum in either direction, signaling a potential period of consolidation.
- Volatility: Volatility indicators point towards decreasing volatility and a possible consolidation phase in the near term.
- Volume: Volume indicators reflect a balanced market sentiment with no significant accumulation or distribution signals.
Conclusion:
Based on the analysis of the technical indicators, the next few days for BND are likely to see sideways movement with a slight bullish bias. Traders may expect the stock price to consolidate within a narrow range as volatility decreases. It is advisable to closely monitor key support and resistance levels for potential breakout opportunities.