Technical Analysis of BLV 2024-05-10
Overview:
In analyzing the technical indicators for BLV over the last 5 days, we will delve into the trend, momentum, volatility, and volume indicators to provide a comprehensive outlook on the possible stock price movement. By examining these key aspects, we aim to offer valuable insights and predictions for the upcoming trading days.
Trend Analysis:
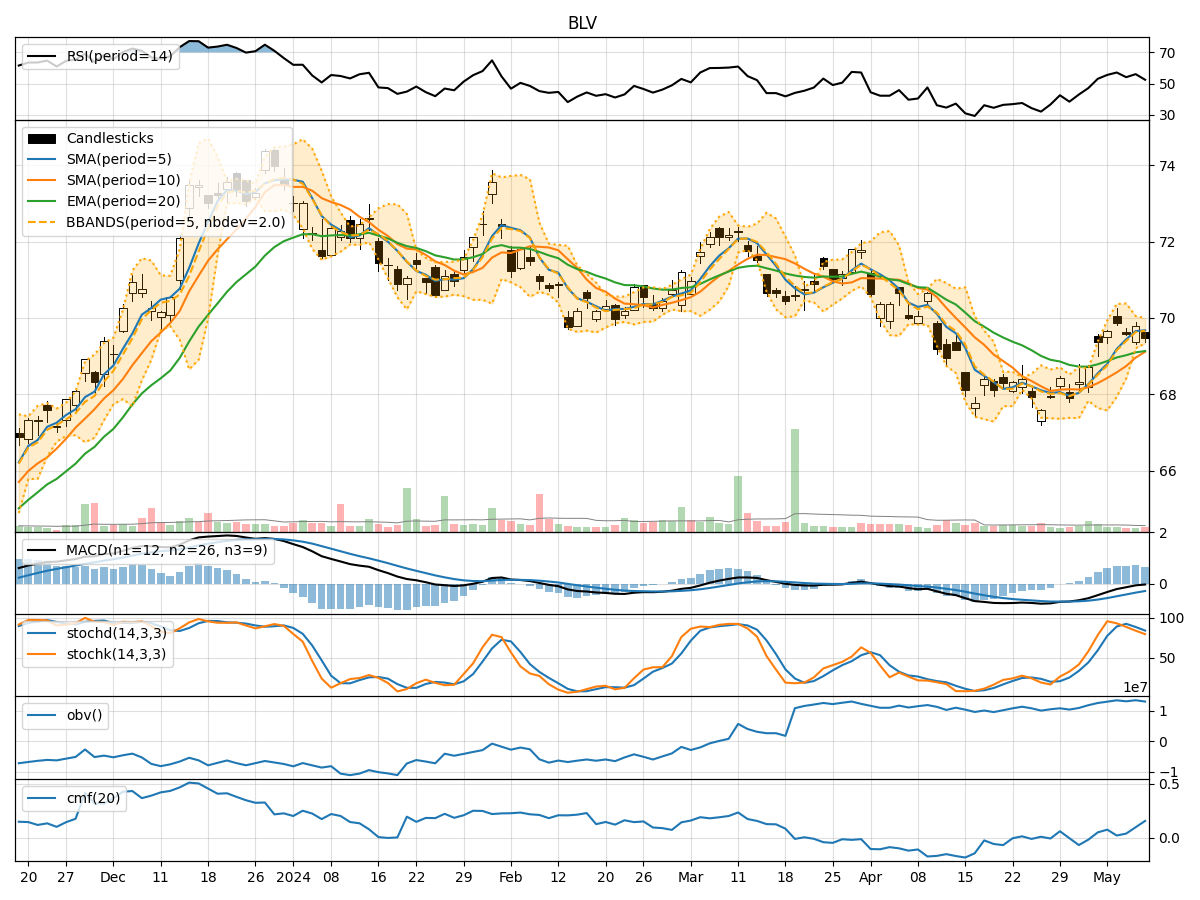
- Moving Averages (MA): The 5-day Moving Average (MA) has been consistently above the Simple Moving Average (SMA) and Exponential Moving Average (EMA), indicating a bullish trend.
- MACD: The MACD line has been negative but converging towards the signal line, suggesting a potential bullish crossover in the near future.
Momentum Analysis:
- RSI: The Relative Strength Index (RSI) has been fluctuating around the neutral zone, indicating indecision in the market.
- Stochastic Oscillator: Both %K and %D have been declining, signaling a potential bearish momentum.
- Williams %R: The Williams %R is in the oversold territory, suggesting a possible reversal in the short term.
Volatility Analysis:
- Bollinger Bands (BB): The stock price has been trading within the Bollinger Bands, with the bands narrowing, indicating reduced volatility.
- Bollinger %B: The %B indicator is hovering around the middle range, reflecting a neutral stance in terms of volatility.
Volume Analysis:
- On-Balance Volume (OBV): The OBV has been relatively stable, indicating a balance between buying and selling pressure.
- Chaikin Money Flow (CMF): The CMF has been positive, suggesting accumulation in the stock.
Key Observations:
- The trend indicators suggest a bullish bias, supported by the moving averages and potential MACD crossover.
- Momentum indicators show mixed signals, with RSI indicating neutrality, while Stochastic Oscillator and Williams %R hint at a bearish sentiment.
- Volatility remains low, as depicted by the narrowing Bollinger Bands and neutral Bollinger %B.
- Volume indicators point towards a balanced market sentiment, with OBV showing stability and CMF indicating accumulation.
Conclusion:
Based on the analysis of the technical indicators, the overall outlook for BLV in the next few days leans towards a consolidation phase. While the trend indicators suggest a bullish bias, the conflicting signals from momentum indicators and the lack of significant volatility indicate a potential sideways movement. Traders should exercise caution and closely monitor key levels for potential breakout or breakdown scenarios.