Technical Analysis of BLES 2024-05-10
Overview:
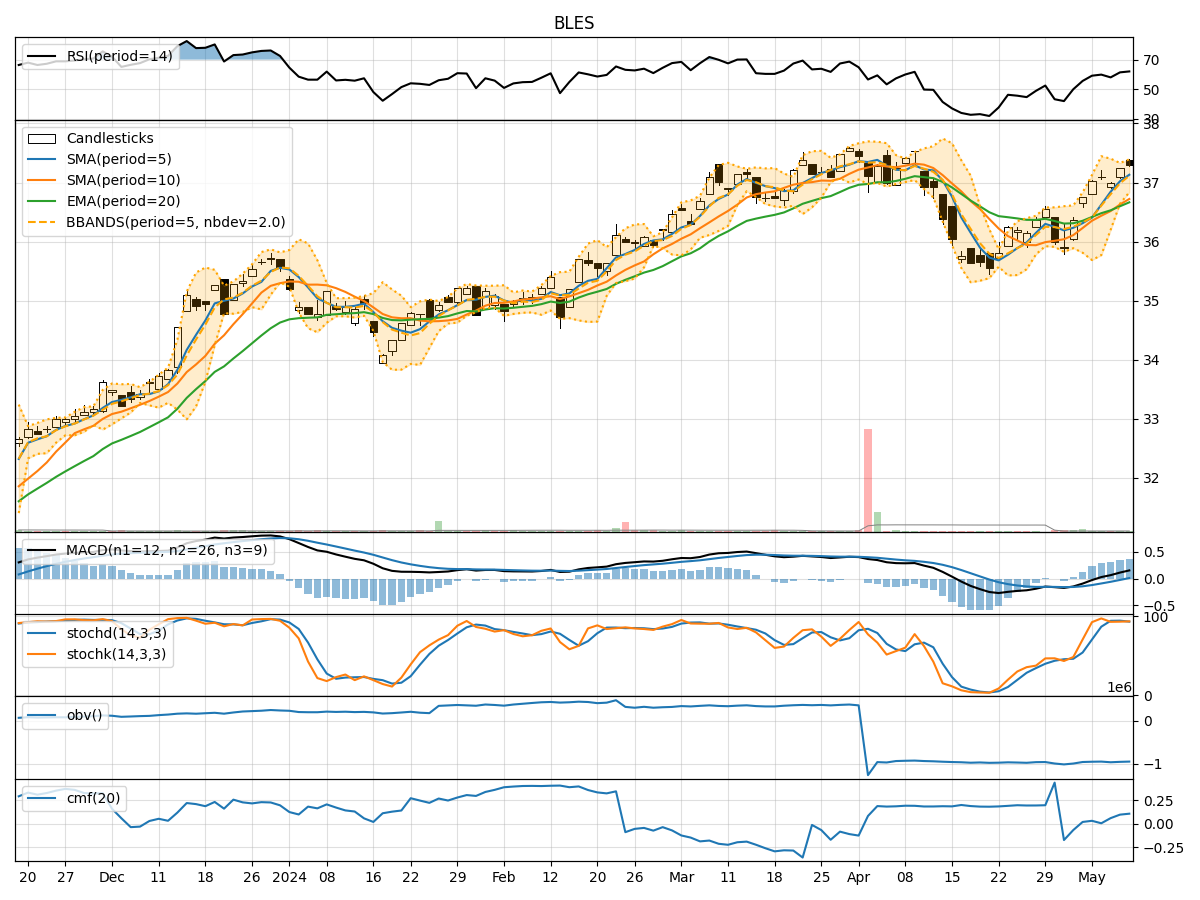
In the last 5 trading days, BLES stock has shown a consistent uptrend in its price, supported by increasing volumes. The moving averages have been trending upwards, indicating a positive momentum. The MACD and RSI are also showing bullish signals. However, the Bollinger Bands suggest a slight overbought condition. Let's delve deeper into each category of technical indicators to provide a comprehensive analysis and make a prediction for the next few days.
Trend Indicators:
- Moving Averages (MA): The 5-day MA has been consistently above the 10-day SMA, indicating a short-term bullish trend.
- MACD: The MACD line has been above the signal line for the past 5 days, suggesting a bullish momentum.
- Conclusion: The trend indicators point towards an upward movement in the stock price.
Momentum Indicators:
- RSI: The RSI has been consistently above 50, indicating strength in the current uptrend.
- Stochastic Oscillator: Both %K and %D have been in the overbought zone, suggesting a potential reversal.
- Conclusion: Momentum indicators suggest a bullish sentiment but with a caution for a possible correction due to overbought conditions.
Volatility Indicators:
- Bollinger Bands (BB): The stock price has been consistently trading above the upper Bollinger Band, indicating an overbought condition.
- Conclusion: Volatility indicators suggest a potential pullback or consolidation in the stock price.
Volume Indicators:
- On-Balance Volume (OBV): The OBV has been slightly decreasing, indicating some distribution happening in the stock.
- Chaikin Money Flow (CMF): The CMF has been positive, suggesting buying pressure.
- Conclusion: Volume indicators are mixed, with OBV showing a slight bearish divergence while CMF indicates bullish sentiment.
Overall Conclusion:
Based on the analysis of trend, momentum, volatility, and volume indicators, the next few days for BLES stock are likely to see a potential pullback or consolidation. The uptrend may continue, but the overbought conditions indicated by the Bollinger Bands and Stochastic Oscillator suggest a need for caution. Traders should watch for signs of a reversal or a temporary pause in the upward movement. It is advisable to monitor the price action closely and consider taking profits or implementing risk management strategies in case of a sudden downturn.
Key Recommendations:
- Monitor Overbought Conditions: Keep a close eye on the Stochastic Oscillator and Bollinger Bands for signs of a reversal.
- Implement Risk Management: Consider setting stop-loss orders to protect profits in case of a sudden downturn.
- Wait for Confirmation: Look for confirmation signals such as a break below the lower Bollinger Band or a divergence in momentum indicators before making significant trading decisions.
In conclusion, while the overall trend for BLES stock remains bullish, caution is advised due to the overbought conditions. Stay vigilant and adapt your trading strategy based on real-time market developments to maximize returns and minimize risks.