Technical Analysis of BETH 2024-05-10
Overview:
In analyzing the technical indicators for BETH stock over the last 5 days, we will delve into the trend, momentum, volatility, and volume indicators to provide a comprehensive outlook on the possible stock price movement in the coming days. By examining these key aspects, we aim to offer valuable insights and predictions to guide investment decisions.
Trend Analysis:
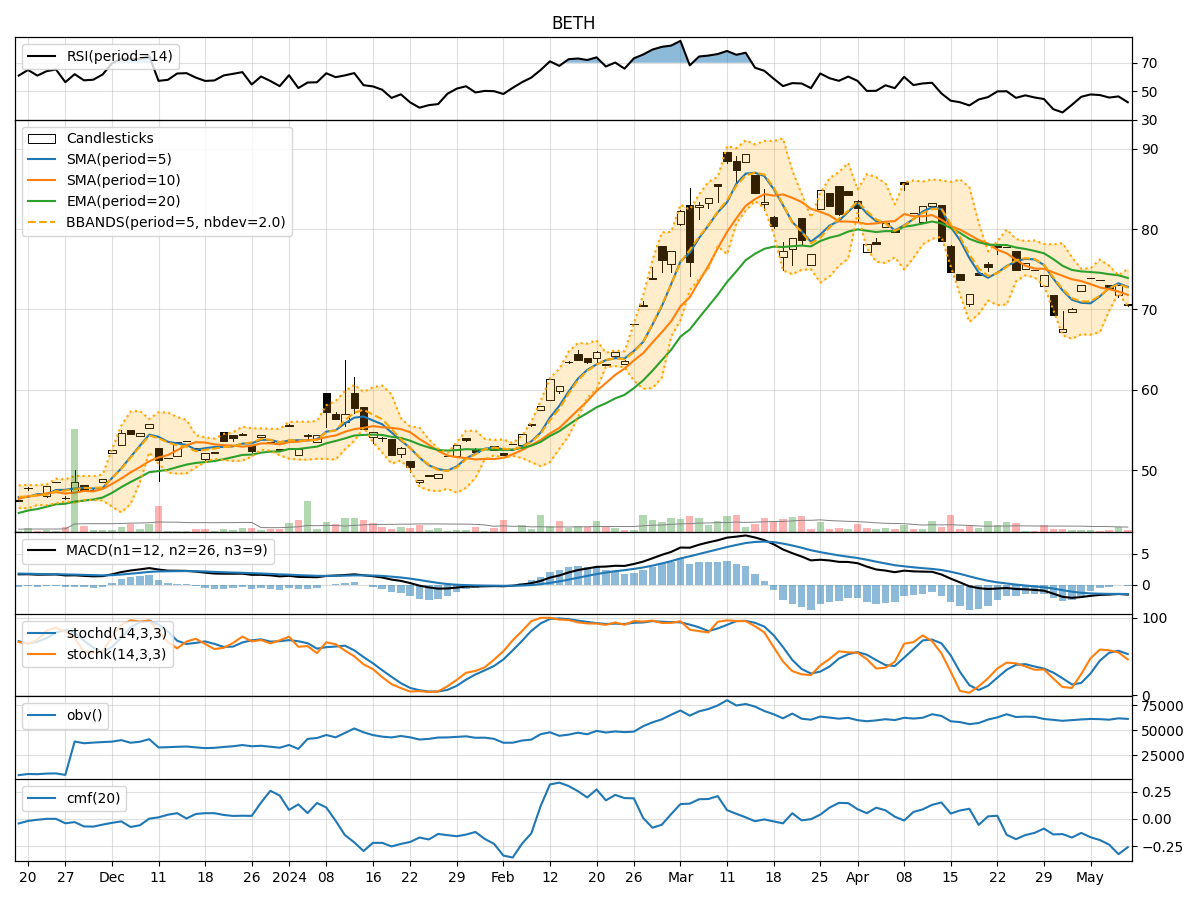
- Moving Averages (MA): The 5-day Moving Average (MA) has been fluctuating around the stock price, indicating short-term volatility. The Simple Moving Average (SMA) and Exponential Moving Average (EMA) show a downward trend, suggesting a bearish sentiment.
- MACD: The Moving Average Convergence Divergence (MACD) is negative, with the MACD line below the signal line, signaling a bearish trend.
- Momentum: The stock price has been below the MA and SMA, indicating a downward momentum in the short term.
Momentum Analysis:
- RSI: The Relative Strength Index (RSI) is below 50, indicating bearish momentum.
- Stochastic Oscillator: Both %K and %D are trending downwards, suggesting a bearish sentiment.
- Williams %R: The Williams %R is in the oversold territory, indicating a potential reversal or continuation of the downtrend.
Volatility Analysis:
- Bollinger Bands: The stock price has been trading below the lower Bollinger Band, indicating oversold conditions and potential for a reversal.
- Bollinger %B: The %B is close to 0, suggesting a possible bounce back in the stock price.
Volume Analysis:
- On-Balance Volume (OBV): The OBV has been decreasing, indicating selling pressure in the stock.
- Chaikin Money Flow (CMF): The CMF is negative, reflecting a bearish sentiment in the stock.
Conclusion:
Based on the analysis of the technical indicators, the stock is currently in a bearish phase with downward trends in moving averages, MACD, RSI, and Stochastic Oscillator. The stock price is likely to continue its downward movement in the coming days. Traders and investors should exercise caution and consider shorting or staying away from long positions until there are clear signs of a trend reversal.