Technical Analysis of BDCZ 2024-05-10
Overview:
In analyzing the technical indicators for BDCZ over the last 5 days, we will delve into the trend, momentum, volatility, and volume indicators to provide a comprehensive outlook on the possible stock price movement. By examining these key aspects, we aim to offer valuable insights and predictions for the upcoming trading days.
Trend Analysis:
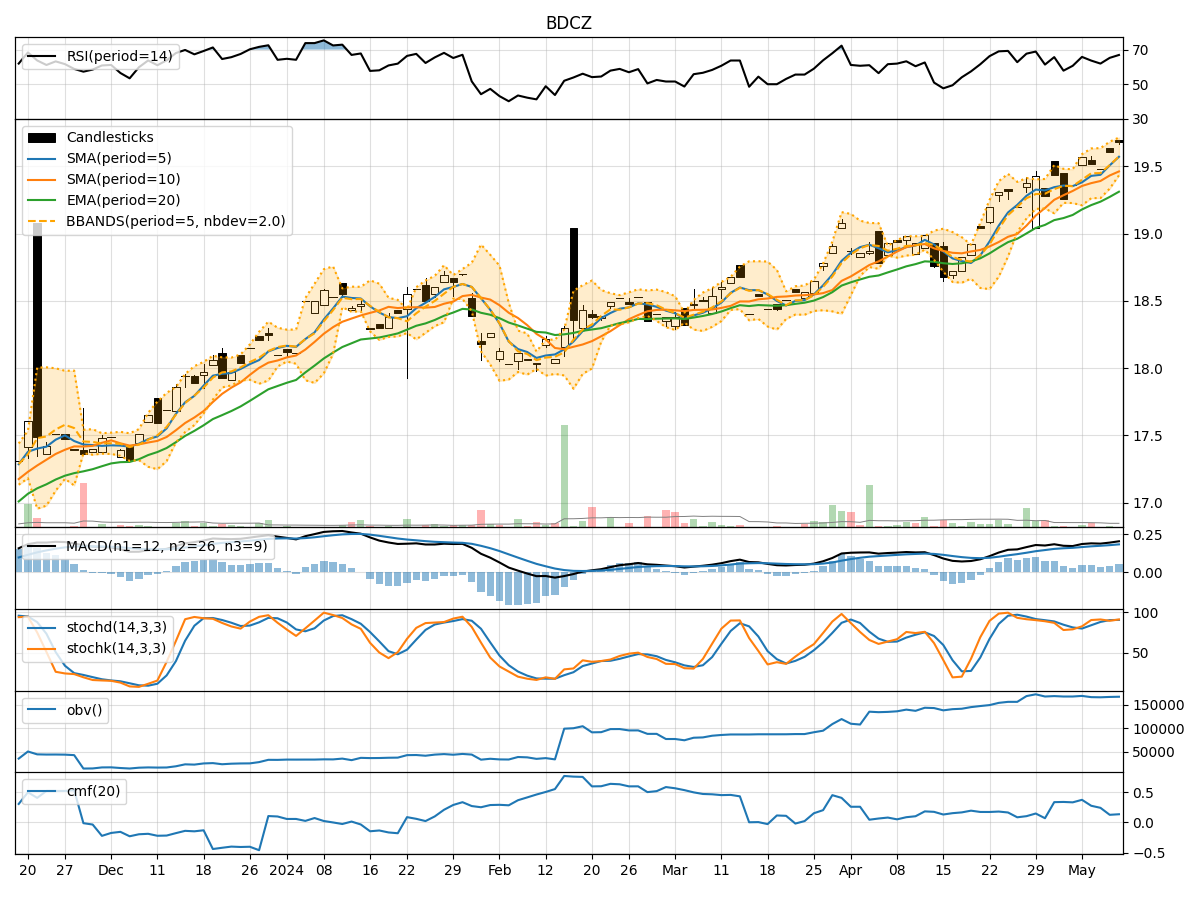
- Moving Averages (MA): The 5-day Moving Average (MA) has been consistently above the Simple Moving Average (SMA) and Exponential Moving Average (EMA), indicating a bullish trend.
- MACD: The MACD line has been consistently above the signal line, with both lines showing an upward trend, suggesting bullish momentum.
Momentum Analysis:
- RSI: The Relative Strength Index (RSI) has been in the overbought territory, indicating a strong bullish momentum.
- Stochastic Oscillator: Both %K and %D lines of the Stochastic Oscillator have been in the overbought zone, signaling a potential reversal or consolidation.
Volatility Analysis:
- Bollinger Bands (BB): The stock price has been trading within the upper Bollinger Band, suggesting an overbought condition and a possible reversal or consolidation.
Volume Analysis:
- On-Balance Volume (OBV): The OBV has been showing a slight increase, indicating some accumulation by investors.
- Chaikin Money Flow (CMF): The CMF has been positive but decreasing, suggesting a potential weakening of buying pressure.
Key Observations:
- The trend indicators point towards a strong bullish sentiment in the short term.
- Momentum indicators indicate a potential overbought condition, signaling a need for caution.
- Volatility indicators suggest a possible reversal or consolidation phase.
- Volume indicators show some accumulation but with a decreasing buying pressure.
Conclusion:
Based on the analysis of the technical indicators, the next few days' possible stock price movement for BDCZ is likely to experience a short-term consolidation or a minor pullback. The bullish trend may continue, but the overbought momentum and the upper Bollinger Band signal a potential correction or sideways movement. Traders should be cautious and consider taking profits or implementing risk management strategies in anticipation of a temporary pause in the upward trend.